just changed last plot to log on X-axis
Source Link
relayman357
  • 3.5k
  • 1
  • 10
  • 20

One way to determine the resonant frequencies is via simulation. You can apply a 1V source at various frequencies (e.g. start at 100Hz and increment). Then plot the current provided by the source vs. frequency (admittance plot). You can apply a 1A source as well, then plot the voltage at terminals of source vs. frequency (impedance plot).

I did both for your circuit in ATPDraw (gui for ATP) and they are plotted below (swept from 100Hz to 50kHz in 100Hz steps).

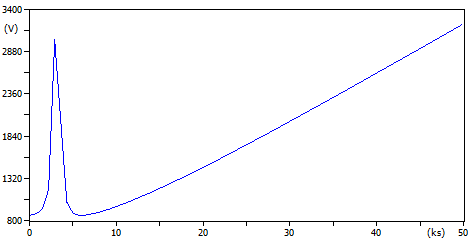
First one is impedance plot, since we are injecting 1A the vertical axis (which is labeled V) is equivalent to Z. Peak is around 2.9kHz (horizontal axis is frequency).

enter image description here

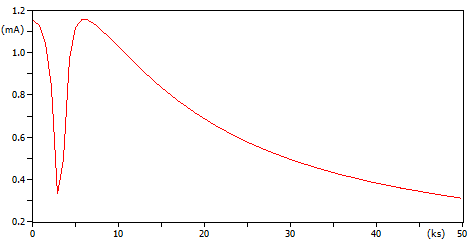
You can narrow it down once you have roughed out where the peaks are. Below is the plot of current vs. frequency when source is 1V. This is admittance plot.

enter image description here

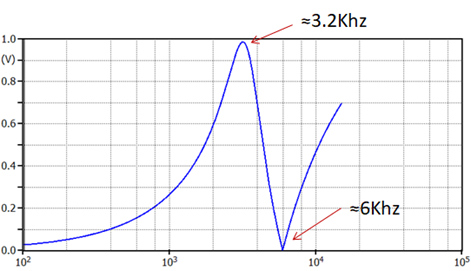
UPDATE: Based on Tony Stewart's tutoring my plot below is Vout/Vin instead of input impedance/admittance like i show above. This one is logarithmic on horizontal axis.

enter image description hereenter image description here

One way to determine the resonant frequencies is via simulation. You can apply a 1V source at various frequencies (e.g. start at 100Hz and increment). Then plot the current provided by the source vs. frequency (admittance plot). You can apply a 1A source as well, then plot the voltage at terminals of source vs. frequency (impedance plot).

I did both for your circuit in ATPDraw (gui for ATP) and they are plotted below (swept from 100Hz to 50kHz in 100Hz steps).

First one is impedance plot, since we are injecting 1A the vertical axis (which is labeled V) is equivalent to Z. Peak is around 2.9kHz (horizontal axis is frequency).

enter image description here

You can narrow it down once you have roughed out where the peaks are. Below is the plot of current vs. frequency when source is 1V. This is admittance plot.

enter image description here

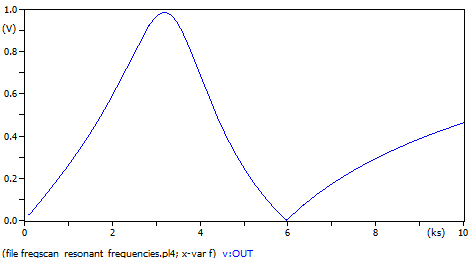
UPDATE: Based on Tony Stewart's tutoring my plot below is Vout/Vin instead of input impedance/admittance like i show above.

enter image description here

One way to determine the resonant frequencies is via simulation. You can apply a 1V source at various frequencies (e.g. start at 100Hz and increment). Then plot the current provided by the source vs. frequency (admittance plot). You can apply a 1A source as well, then plot the voltage at terminals of source vs. frequency (impedance plot).

I did both for your circuit in ATPDraw (gui for ATP) and they are plotted below (swept from 100Hz to 50kHz in 100Hz steps).

First one is impedance plot, since we are injecting 1A the vertical axis (which is labeled V) is equivalent to Z. Peak is around 2.9kHz (horizontal axis is frequency).

enter image description here

You can narrow it down once you have roughed out where the peaks are. Below is the plot of current vs. frequency when source is 1V. This is admittance plot.

enter image description here

UPDATE: Based on Tony Stewart's tutoring my plot below is Vout/Vin instead of input impedance/admittance like i show above. This one is logarithmic on horizontal axis.
enter image description here

added transfer function plot
Source Link
relayman357
  • 3.5k
  • 1
  • 10
  • 20

One way to determine the resonant frequencies is via simulation. You can apply a 1V source at various frequencies (e.g. start at 100Hz and increment). Then plot the current provided by the source vs. frequency (admittance plot). You can apply a 1A source as well, then plot the voltage at terminals of source vs. frequency (impedance plot).

I did both for your circuit in ATPDraw (gui for ATP) and they are plotted below (swept from 100Hz to 50kHz in 100Hz steps).

First one is impedance plot, since we are injecting 1A the vertical axis (which is labeled V) is equivalent to Z. Peak is around 2.9kHz (horizontal axis is frequency).

enter image description here

You can narrow it down once you have roughed out where the peaks are. Below is the plot of current vs. frequency when source is 1V. This is admittance plot.

enter image description here

UPDATE: Based on Tony Stewart's tutoring my plot below is Vout/Vin instead of input impedance/admittance like i show above.

enter image description here

One way to determine the resonant frequencies is via simulation. You can apply a 1V source at various frequencies (e.g. start at 100Hz and increment). Then plot the current provided by the source vs. frequency (admittance plot). You can apply a 1A source as well, then plot the voltage at terminals of source vs. frequency (impedance plot).

I did both for your circuit in ATPDraw (gui for ATP) and they are plotted below (swept from 100Hz to 50kHz in 100Hz steps).

First one is impedance plot, since we are injecting 1A the vertical axis (which is labeled V) is equivalent to Z. Peak is around 2.9kHz (horizontal axis is frequency).

enter image description here

You can narrow it down once you have roughed out where the peaks are. Below is the plot of current vs. frequency when source is 1V. This is admittance plot.

enter image description here

UPDATE: Based on Tony Stewart's tutoring my plot below is Vout/Vin instead of input impedance/admittance like i show above.

enter image description here

Source Link
relayman357
  • 3.5k
  • 1
  • 10
  • 20

One way to determine the resonant frequencies is via simulation. You can apply a 1V source at various frequencies (e.g. start at 100Hz and increment). Then plot the current provided by the source vs. frequency (admittance plot). You can apply a 1A source as well, then plot the voltage at terminals of source vs. frequency (impedance plot).

I did both for your circuit in ATPDraw (gui for ATP) and they are plotted below (swept from 100Hz to 50kHz in 100Hz steps).

First one is impedance plot, since we are injecting 1A the vertical axis (which is labeled V) is equivalent to Z. Peak is around 2.9kHz (horizontal axis is frequency).

enter image description here

You can narrow it down once you have roughed out where the peaks are. Below is the plot of current vs. frequency when source is 1V. This is admittance plot.

enter image description here