More Information
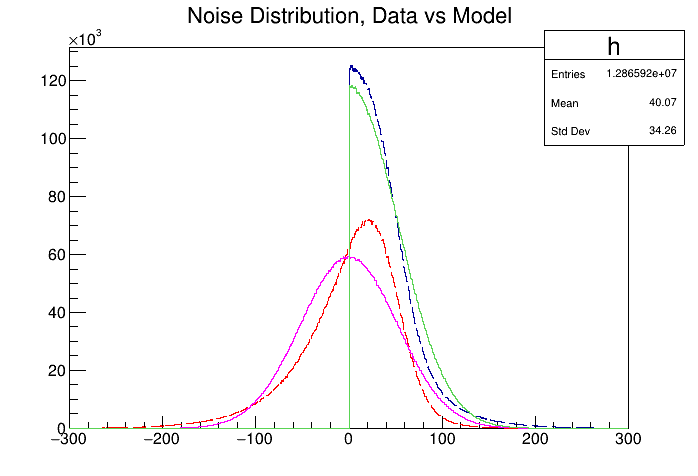
I mentioned that we find the simplistic model to be insufficiently close to data. I've created a plot demonstrating this. The red and blue dotted lines are data (in red, the distribution of voltage values observed at the antennae, in blue, the distribution of their magnitude (i.e. absolute value)), and the green and pink lines are simulation (for each real data point, I generated a simulated data point according to the model and added it to the histogram).

These differences are not localized in time, and do not appear to be due to any equipment issues/calibration issues/etc.
It occurs to me that in some texts the simple Gaussian model is derived by approximating the electric field vectors due to thermal noise as \$2\$-dimensional, complex phasors whose components are identically and independently normally distributed. Their magnitude is then Rayleigh distributed, however when observed at an antenna only the real part is recorded, hence the voltage values are Gaussian distributed, and their magnitude is distributed according to a folded Gaussian.
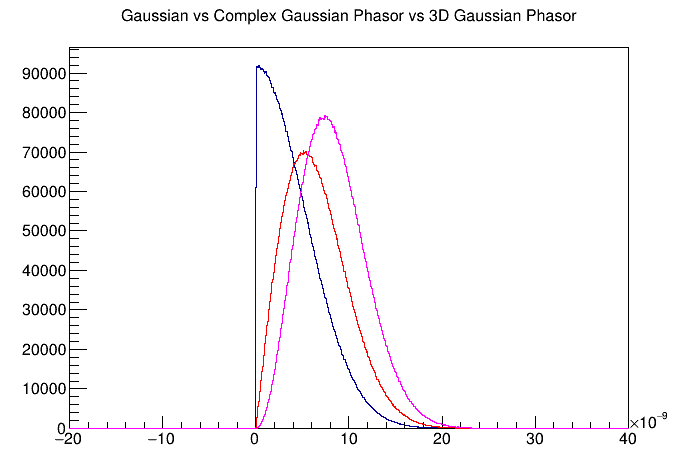
In practice, of course, the electric field vectors are $3$-dimensional, and their magnitudes are distributed according to a "three-dimensional" Rayleigh distribution. In the \$2\$D bivariate normal model, the real part is what is recorded when the signal is digitized by the antenna, and it is Gaussian distributed. In the more accurate \$3\$D, what is recorded, and how is it distributed? Below, I've plotted the magnitude distribution of a \$3\$D phasor with IID Gaussian-distributed components in red, the magnitude of a \$2\$D complex phasor with IID Gaussian-distributed components in pink, and the distribution of the real parts of those complex phasors in blue (for 1E+9 randomly-generated phasors, and some arbitrary value of \$\sigma\$):


