Became Hot Network Question
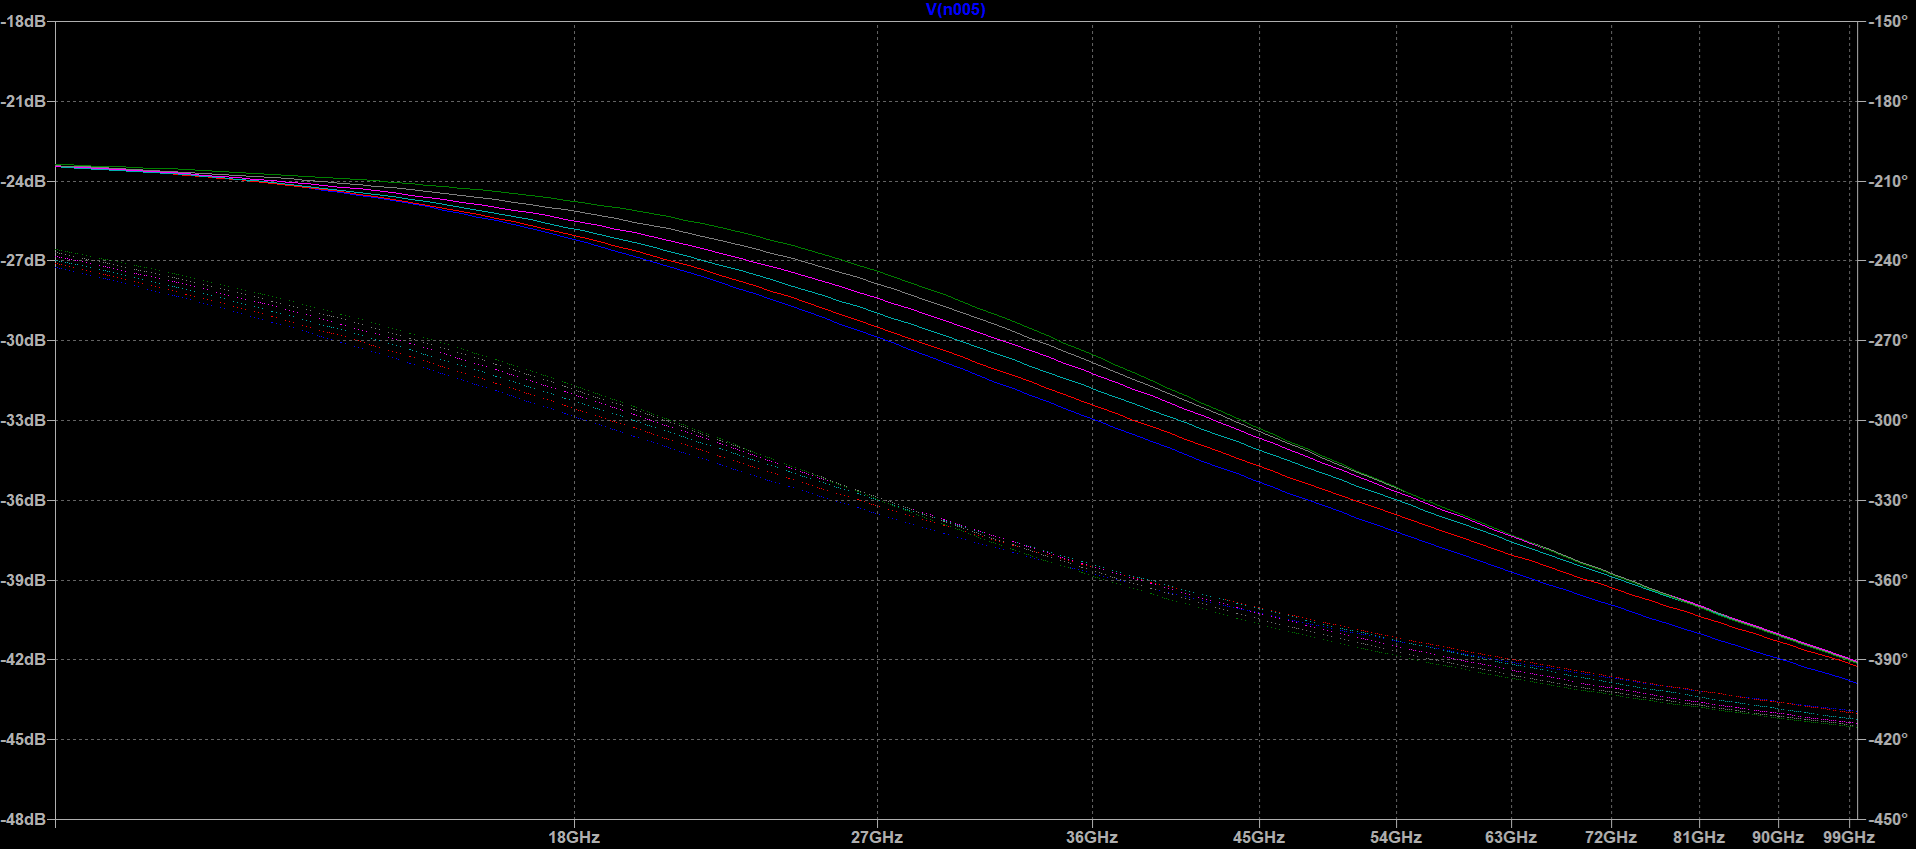
updated circuit schematic and corresponding graph
Source Link

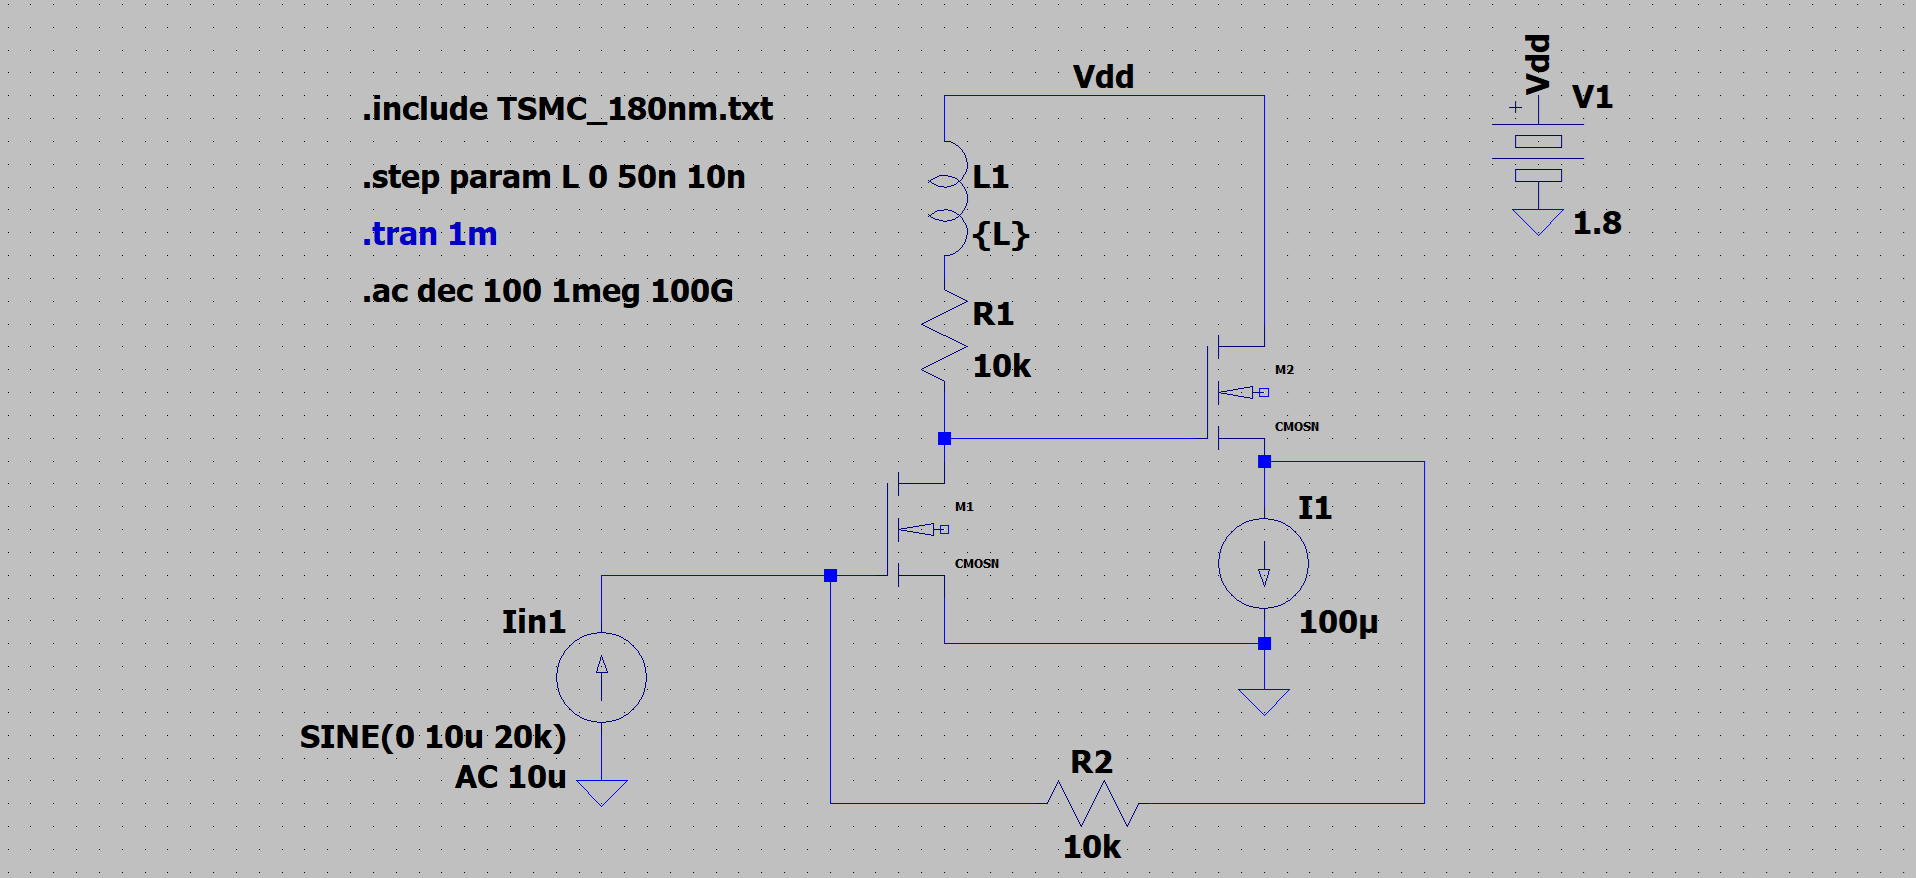
I am trying to simulate the frequency response of a trans-impedance amplifier in LTspice, with a current source input, as shown below:

enter image description hereenter image description here

My question is when doing ac analysis, the gain that LTspice plots, is it voltage gain (as in output voltage by the voltage at input node)? Or does it plot trans-impedance gain? (output voltage by input current) since my input is a current source. If it is the former, is there any way I can plot trans-impedance gain vs frequency in LTspice? enter image description hereenter image description here
I am trying to simulate the frequency response of a trans-impedance amplifier in LTspice, with a current source input, as shown below:

enter image description here

My question is when doing ac analysis, the gain that LTspice plots, is it voltage gain (as in output voltage by the voltage at input node)? Or does it plot trans-impedance gain? (output voltage by input current) since my input is a current source. If it is the former, is there any way I can plot trans-impedance gain vs frequency in LTspice? enter image description here

added 7 characters in body
Source Link
winny
  • 16.8k
  • 6
  • 50
  • 71

I am trying to simulate the frequency response of a Transtrans-impedance amplifier in LTspice, with a current source input, as shown below:

enter image description here

My question is when doing ac analysis, the gain that LTspice plots, is it voltage gain? (as in output voltage by the voltage at input node) or? Or does it plot trans-impedance gain? (output voltage by input current) since my input is a current source. If it is the former, is there anywayany way I can plot trans-impedance gain vs frequency in LTSpice LTspice?  enter image description here

I am trying to simulate the frequency response of a Trans-impedance amplifier in LTspice, with a current source input, as shown belowenter image description here

My question is when doing ac analysis, the gain that LTspice plots, is it voltage gain? (as in output voltage by the voltage at input node) or does it plot trans-impedance gain? (output voltage by input current) since my input is a current source. If it is the former, is there anyway I can plot trans-impedance gain vs frequency in LTSpice ?enter image description here

I am trying to simulate the frequency response of a trans-impedance amplifier in LTspice, with a current source input, as shown below:

enter image description here

My question is when doing ac analysis, the gain that LTspice plots, is it voltage gain (as in output voltage by the voltage at input node)? Or does it plot trans-impedance gain? (output voltage by input current) since my input is a current source. If it is the former, is there any way I can plot trans-impedance gain vs frequency in LTspice?  enter image description here
Source Link

What does Gain mean when LTSpice plots Gain vs Frequency in AC analysis?

I am trying to simulate the frequency response of a Trans-impedance amplifier in LTspice, with a current source input, as shown belowenter image description here

My question is when doing ac analysis, the gain that LTspice plots, is it voltage gain? (as in output voltage by the voltage at input node) or does it plot trans-impedance gain? (output voltage by input current) since my input is a current source. If it is the former, is there anyway I can plot trans-impedance gain vs frequency in LTSpice ?enter image description here