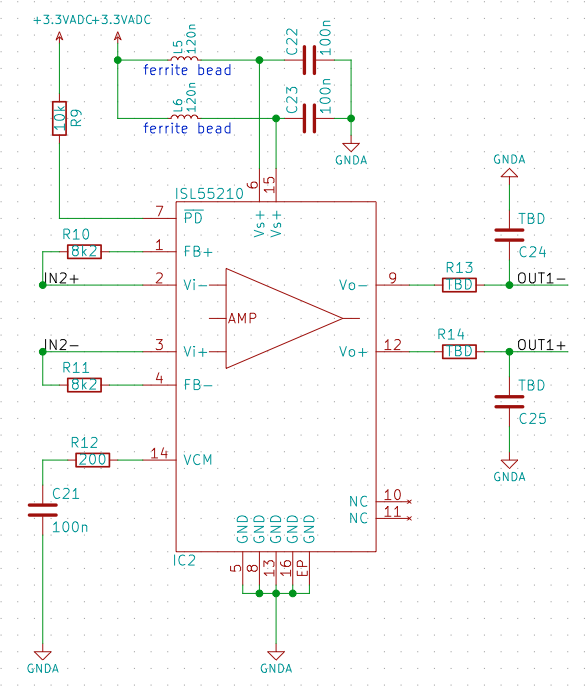
I have a fully diffrential opamp that is configured like seen in the below picture:
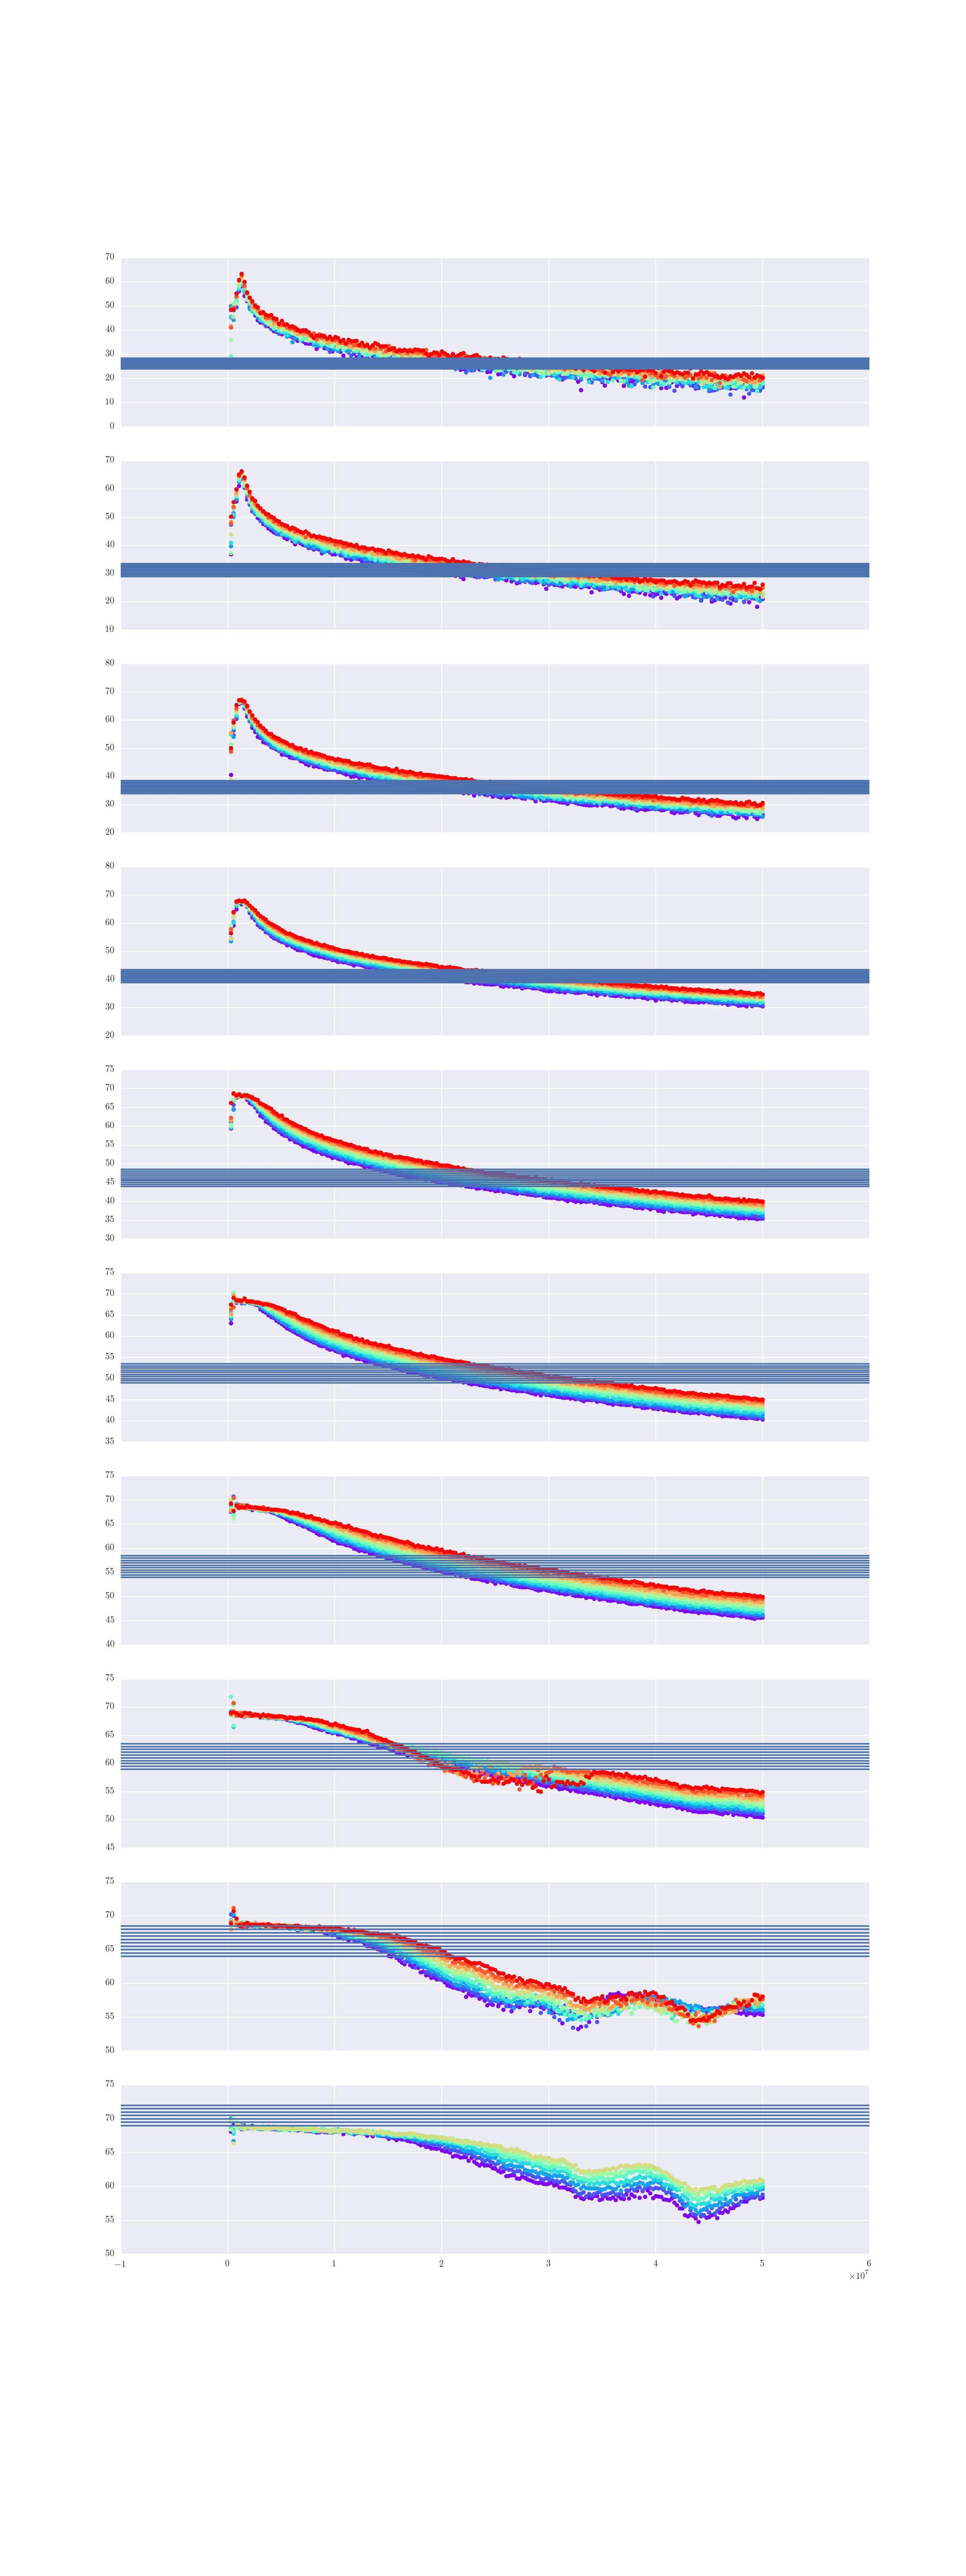
I have a series of Frequency sweeps (differently scaled input) that I performed and measured with a VNA. The weird part is that it looks so skewed:
Blue is the expected amplification according to calculations (should def. be true) while the colored dots are the sweeps at different input amplitudes each color.
The OpAmp s configured to amplify approximately 29dB. So according to the Datasheet this should be zero issue up until 100MHz (it's on page 6 of the ISL55210 DS). Since I sweep only up until 50MHz I am very confused how it results in this broken curve .. It's also not a circuit that's very complicated ...
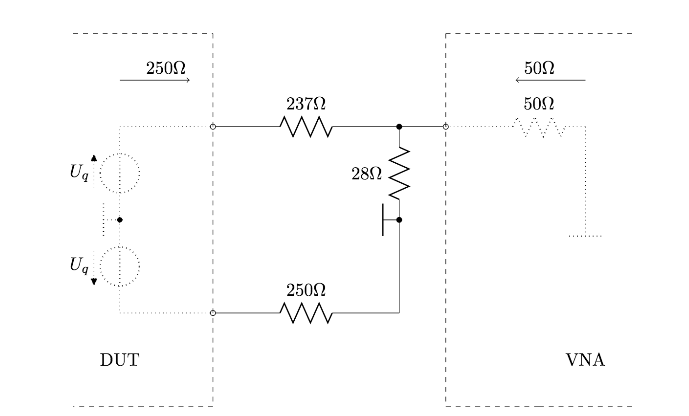
EDIT: I measure the DUT like seen below, except that there is a 1uF Capacitor in between the adaptor and the VNA to block any DC:
The input is generated by an AD8331 which works 100% properly as verified in separate measurements. The AD8331 is connected with two 270 Ohm Resistors.
I would be grateful for any hint what I could check ...
P.S. The peak at the beginning is not less strange ...


