NEW:
OK - 3rd time lucky - I'll edit all this "after the event" to remove material that has got too far off course:
The problem [tm]
- My total argument is based around the understanding that you are tilting the photodiode off axis and NOT rotating it. If you are tilting it off axis relative to the centre of a half sphere then the following applies. If you are rotating it, then read the rest of the material :-).
The problem is that when you tilt the sensor off axis and then sweep the beam across the surface of the sensors "half sphere of sensitivity response" he beam is not crossing the centre of the sensors sensitivity sphere, except when tilt angle is zero. ie the variable geometry of your method is not representing the sensor response sphere properly. All you have to do to get a proper 3D characterisation is to rotate the sensor and then sweep the beam through 180 degrees.
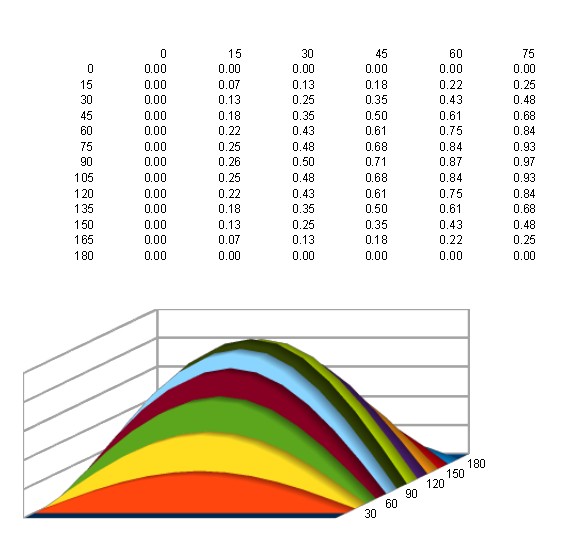
The 3D graph below and partial table show you what is happening.
The graph is a plot of 15 degree steps across a half sphere from 0 degrees to 180 degrees in X and Y axis.
X axis = sweep of sensor 0 - 180 degrees.
Y axis = tilt of sensor 0 - 180 degree, with 90 degrees being normal to mounting surface.
Z axis is the product of sine (x angle) * sine(y angle)
The graph represents the mapping of the intensity of light falling normally on your sensor due to variations in angle due to sweeping of your beam in one axis AND tilting of the senor on another. The resultant SinA x SinB 3D surface forms a series of "hills" with varying height. The only legitimate curves are those which pass through the centre of the half sphere. The only legitimate curve shown here is the dark green one with Y axis = 90 degrees. All the other curves represent a tilted sensor with the beam never sweeping across the centre of the sensor. QED.

I've left the rest of the material in here as it all has some relevance - but I think the above (corresponding to the "cut to the chase" section at the end probably contains your answer. You may have to work through the spherical model section preceding it to visualise what is happening. If so, get a plastic beach ball and some dry erase markers before you start :-). I can visualise it now but initially it wouldn't gel mentally.
OLD:
Method is suspect
My experience with LED characterisation discussed - inverse of you problem and much in common
Sources of error discussed.
A "certain to work" method of checking half-spherical response is proposed. but - You may consider "cutting to the chase" and reading "sure fire evaluation rig" at the end :-).
Arising from the "surefire method" is the indication that the "true" angle of pointing when tilt and rotation are combined may not be what it seems to be. Tilt and rotate appears to be varying two angles at once with the sensor response being the product of the sensitivities for the two angles involved - which is probably what you are seeing.
I have used similar setups to characterise LEDs and arrays of LEDs. It only occurred to me as I wrote this that your assumption about half spherical symmetry may be incorrect. As this is uncertain and not wholly intuitive I have dealt with it last under "symmetry"
Items to look for are light paths other than the intended one and light sources other than intended. I found that beam reflections off unintended surfaces made a significant difference to my measurements.
You say "change the orientation of the photodiode" but you may be changing the orientation of the LASER. Results can be different.
If you are tilting the photodiode then it's most sensitive 0 degrees axis is "looking" at off beam objects while you illuminate it.
If you have a horizontal table or desk surface in your setup - even if it is notionally non reflective and even if there should be little beam energy there it can have an effect.
If there are off axis sources the sensor will respond differently if angled towards or away from them.
I used a simple aperture plate (aka mask or guide or shield or ...) to mask out most alternative light paths.
A good test is to take a sheet of opaque material and "wander it around" in the workspace while the beam is being measured without obstructing the intended beam bath. Clearly it should have no effect. If it does you have alternative paths or sources.
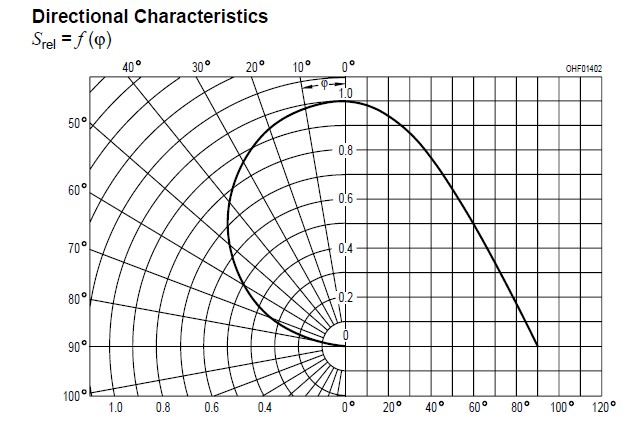
The diagram below shows the datasheet response curve for your device. You say the response will be spherical but it would of course be "half spherical" at best (and I assume that that is what you meant). I assume that you meant that the response curve with angle from axis would be the same in any radial direction. eg Response at 45 degrees is shown in the graph below as being about 0.71 of the 0 degree response. In the absence of information to the contrary, this should be the same result at 45 degrees immediately up from center, 45 degree down from centre, 45 degrees left of centre or 45 degrees right of centre.
If this is not true then you can try a test which seeks to demonstrate that the response of the device rather than the illumination from the measuring setup varies.

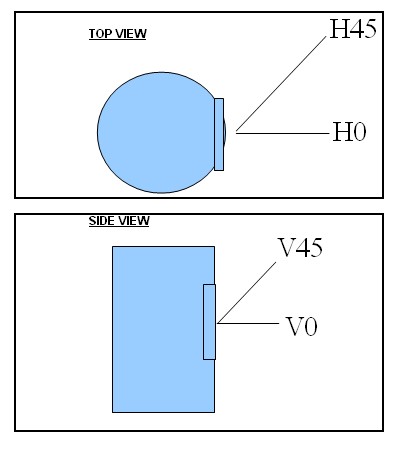
Below are two representations of the device as viewed from the top and from the side with major sensitivity axis to the right of the diagram in each case.
In the top view, a beam from H45 (horizontal, 45 degrees off axis) should elicit about 70% of the response of the same beam from H0 (Horizontal, 0 degrees off axis). A beam from h-45 (not shown but obviously 45 degrees down from h0 in this diagram or in practice 45 degrees radially off centre in a horizontal plane through the centre of the sensor).
In the side view (sensitive window facing towards right of diagram) V0 is the exact same axis as Ho in the top view, V45 is a beam from 45 degrees above the center of the sensor window and v-45 would be a similar beam from 45 degrees below the centre. V45 response should be about 70% of V0 response and V-45 should equal v45. Also properly V45 = v-45 = H45 = H-45
The same arrangements apply for beams from other angels such as H30, H-30 etc, with the "proper" response compared to H0/V0 being read from the sensitivity graph.
Possible happenstances:
From what you said, H45 = H-45, H30 = H-30 etc.
From what you said H45 <> V45 etc.
So

Symmetry:
Your stated assumption about spherical symmetry (or half spherical) seemed to make sense initially. For emitters such as LEDs they tend to be point sources with the output level curve (the equivalent of your response curve) having "rotational symmetry" around the centre axis.
I would "expect" the device to be spherically symmetrical but it is conceivable that light from above and below axis exhibits an additional sine of off-axis-vertical-angle decrease - or some other law. Plotting results achieved at off axis angles of tilt would show visually if there was some smooth "law" in action. (eg linear decrease wuth tilt angle or sine, square, square-root etc).
Sure-fire evaluation method.
Best last :-).
You say you are willing to spend up to $1000. This costs much less than that in material but takes a degree of effort.
(1) Construct a half sphere of material of your choice of as large a size as you are reasonably able to do. This could eg by done with papier mache on an exercise ball. Newsprint and some paste and a happy few hours playing should produce a workable result. There are probably easy ways of getting larger half spheres than that.
(2) Provide a horizontal surface with sensor facing vertically upwards at centre (or vertical surface with sensor horizontal, but horizontal arrangement makes next step easier.)
(3) Coat flat surface plus inside of sphere with matt black surface - matt black polyurethane enamel should suffice.
(4) Provide small entry holes for light source spherically evenly distributed across half sphere. Probably every 30 degrees in arcs of the same separation would suffice to start. eg if spaced at 30 degree steps there are 7 holes at 0 30 60 90 120 150 180 degrees. As the 0 and 180 are about useless you could be happier with 20 or 15 degree steps.
Holes = (180/step_angle) + 1 - See: "number of holes" below.
(5) Consider masking unused holes with black mask - tape or whatever. this is annoying in operation and you could start with minimal external light compared with beam and see what happens.
(6) Insert light at each hole in turn, normal to sphere surface and impinging radially on sensor. If beam can be focused (which seems a very very good idea) try to reduce spot size to be about sensor surface size at distance involved.
Cut to the chase: Prior to building and trialling the above carry out some thoughts experiments (pen and paper and spreadsheeting may also be used if less capable than Isaac Newton at visualisation of effect of 3D motions involved.) Think about what happens when you tilt the beam to say 60 degrees off centre and traverse an arc. As ends are approached the beam angle is dropping towrds 90 degrees in two directions at once !. Response is (probably) the product of the sensitivities for the two angles involved !!!
To get true 1D variation in angle you need to traverse a 1/4 circular path on the sphere surface but tilt and rotate is tracing out an arc with angle varying in 2 dimensions at once. I think :-) (Not being Sir Isaac class myself).
Number of holes:
For 30 degree steps as above with 7 holes per arc, there are also 7 "arcs" The 0 degree arc is flat on the horizontal surface and all holes are at 90 degrees to the sensor. The next arc is at 30 degrees off the surface and has 7 holes but the first and last are common to all other arcs so there are 5 unique holes per arc.
Total holes = ((180/step + 1) arcs x (180/step -1) unique holes per arc ) + 2
= (180/step)^2 +1 holes
eg
for 30 degree steps, holes needed = (180/30)^2 +1 = 37
for 20 degree steps, holes needed = (180/20)^2 +1 = 82
for 15 degree steps, holes needed = (180/15)^2 +1 = 145
Starting with 30 degree steps seems wise :-)


