If you will simulate a BJT in simplest form you will almost certainly have to deal with at least two cases: active and saturated modes. The simulation process for this could be to assume active mode, see where that takes the simulation and, if it generates inconsistent (illogical) results, you then assume saturated mode and process things again on that basis. If that also returns illogical results, then generate an error. Otherwise, report as appropriate.
One question I'd have is whether or not you intend on allowing the ambient temperature to be specified. That can significantly affect a circuit and I have a hard time imagining much good to simulation if you can't handle varying the temperature. If you support varying the operating temperature, then you will have to deal with varying the saturation current, \$I_\text{SAT}\$, with temperature -- because it dominates everything else. And this requires a few more bits of information to ferret out from a datasheet.
But let's assume you can just assume the ambient temperature and therefore the thermal voltage, \$V_T\$, and that the saturation current is similarly unchanging.
For active mode, you will need at least \$\beta_\text{forward}\$, \$I_\text{SAT}\$ and the ideality factor, \$\eta\$. (You will be assuming away current crowding, Ohmic resistances in the leads and semiconductor bulks, and surface effects, to keep this simple.)
Here's a 2N2222 datasheet and the other one with a different pinout, just in case, P2N2222 datasheet to refer to. (Yes, the 2N2222 comes in two different pinouts from OnSemi alone. Can be frustrating to those not expecting this problem.)
\$\beta_\text{F}\$
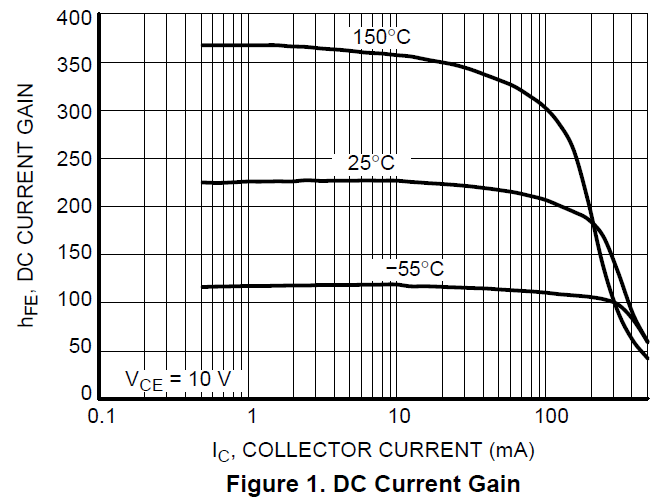
For this figure, just look over these charts on the datasheets mentioned above. Here's the one from the 2N2222A datasheet:

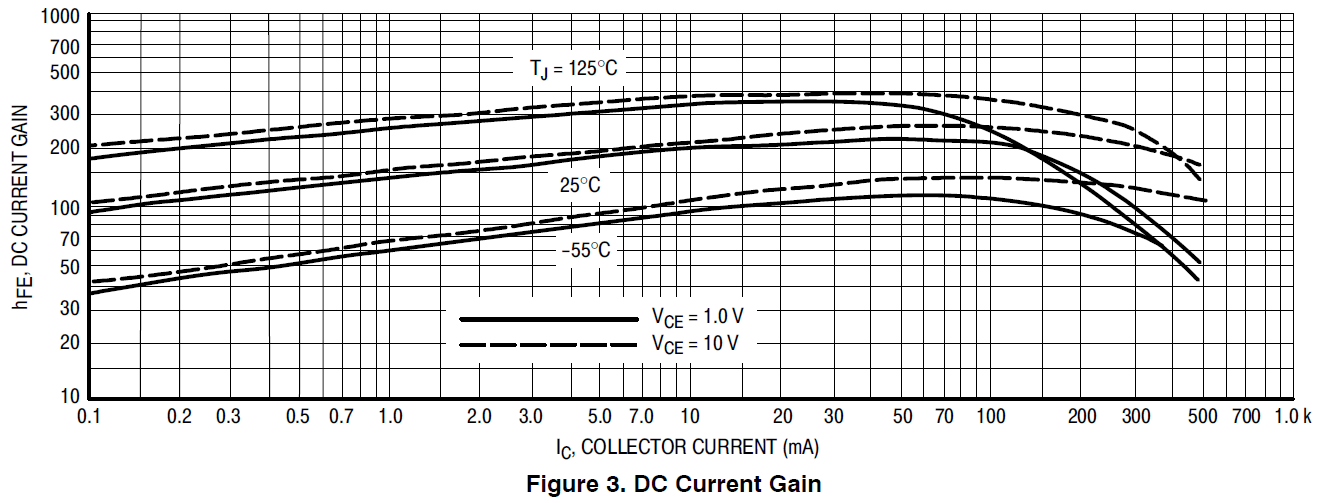
Do take note of the fact that it cites \$V_\text{CE}=10\:\text{V}\$. At this point, you may be tempted to use BF=220, or so. But let's look at the P2N2222A chart, which is more detailed:

Note that this covers \$V_\text{CE}=10\:\text{V}\$ and also \$V_\text{CE}=1\:\text{V}\$. Also, note that the curves aren't so flat. From this chart, I'd be more tempted to go with BF=200. Or maybe even less.
In practice (and I have 26,000 of these devices to play with, here), I find that \$\beta=200\$ is a good figure. But you will need to make a choice. At least, you can now see where to look when making that choice.
Something else that may not be clear to you is that in the first chart above, the one that only specifies the case with \$V_\text{CE}=10\:\text{V}\$, it includes an Early Effect in the computation. It's only in the lower chart from the P2N2222A, that you can see the value of \$\beta\$ without much applied Early Effect because it offers a curve for \$V_\text{CE}=1\:\text{V}\$.
Saturation current and non-ideality factor
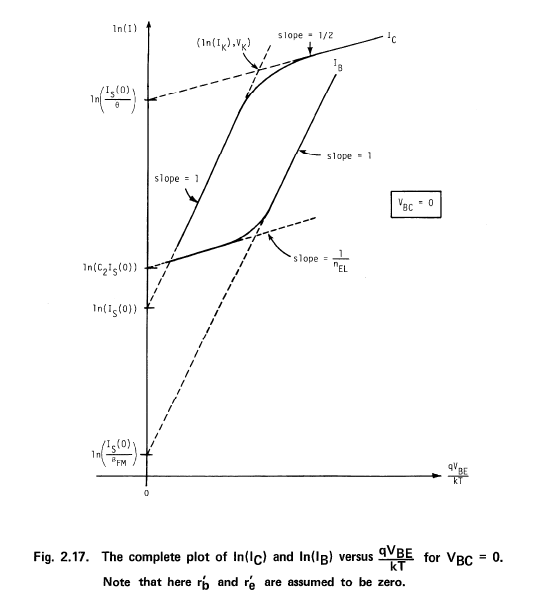
A useful summary of the situation is taken from "Modeling the Bipolar Transistor," by Ian Getreu. My copy is from the reprint on November of 1979 (when I received my first copy of it while working at Tektronix.)

Note that the slope is 1. This is almost always the case for small-signal BJTs. (But rarely the case for high-current, high-power devices.) But at least you can see the slope is what you want when computing \$\eta\$. You can also see how the saturation current value is also extracted, as well.
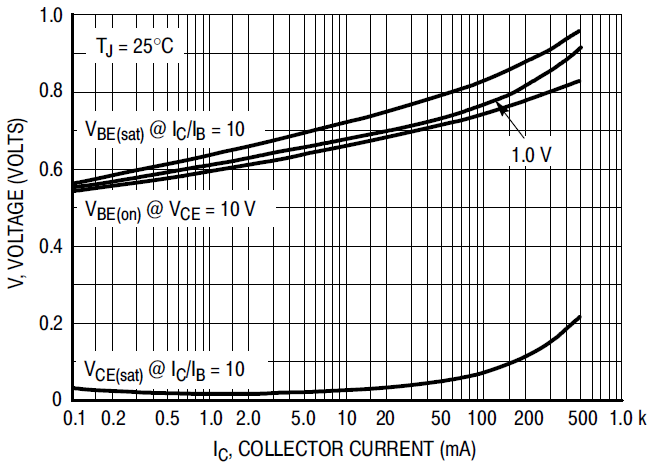
To achieve these, you can draw from yet another chart -- found only on the P2N2222A datasheet:

It should be reasonably easy to develop an equivalent chart needed to find the saturation current and the non-ideality factor, if it deviates much from 1. Just pick off points and work out the values and plot. Use a ruler to extrapolate to the \$y\$-axis for the saturation current. Check the slope value by picking off two points and doing the math.
That should get you close enough on the Ebers-Moll DC model (level 1 and the simplest.) That model also includes the factor, \$E_g\$. But that's important in working out the temperature variation of the saturation current and I am guessing you don't need that for now. (Default is \$E_g=1.1\:\text{eV}\$.)


