6
\$\begingroup\$

I'm having a senior moment and would appreciate clarity.

I'm working on an inverting amplifier design where I need to add low-pass filtering and a voltage clamp.

Without the filtering and clamp, the op-amp configuration would simply be a feedback resistor from output to (-) input and the input resistor from signal source to (-) input.

Worst case error is the sum of the resistor tolerances but statistical averaging usually gives better results than worst case. The figure that I've used in the past is the inverse of the square-root of the number of components (about 0.7% if using 1% resistors).

Now I'm going to split the input resistor into two equal-value resistors, half the value of the original single resistor.

Intuition says that the statistical average error now decreases slightly to the inverse of square-root (3) or about 0.58% if using 1% resistors.

Am I out to lunch or is this a reasonable assumption to make?

Note: the worst case error is still 2% in both cases. Worst case error is what I use when I'm calculating my total error, statistical average is the number I use when estimating the typical error.
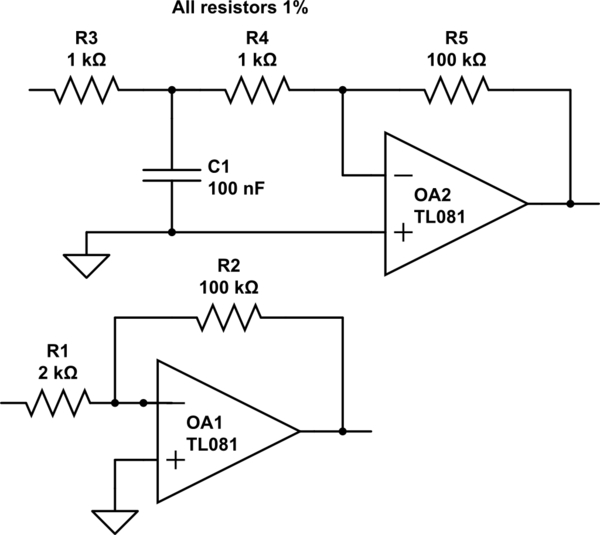
schematic

simulate this circuit – Schematic created using CircuitLab

\$\endgroup\$
5
  • 2
    \$\begingroup\$ What you are looking for is called "propogation of uncertainty", which is a set of identities and rules that tell you how to add uncertainties (errors) together , It is different depending on the combining function. For Series additions, the total uncertainty in equivalent resistance is the root of the sum of the squares of individual resistance uncertainties. wiki article . You can calculate the total uncertainty in network impedance using algebra and the provided identities \$\endgroup\$
    – crasic
    Commented Feb 19, 2016 at 21:53
  • 6
    \$\begingroup\$ Note that these numbers often have little value for real world circuits since there 1) you need to consider the worst case anyways and 2) distribution of real components are sometimes surprisingly weird and do not follow those assumed by the formulas you are going to use here \$\endgroup\$
    – PlasmaHH
    Commented Feb 19, 2016 at 21:59
  • \$\begingroup\$ On a side note, using parallel or serial resistors is a great way to minimize self heating effects. You could also use it to get more precise values if you can't find the exact value your looking for. \$\endgroup\$
    – Voltage Spike
    Commented Feb 19, 2016 at 22:12
  • \$\begingroup\$ As PlasmaHH pointed out in a comment, you would need to take the distribution of values into account. One thing working in your favor is that the components from the same lot will often match very well, so if you had a simple inverter with a gain of -1 and used two equal-value resistors, the typical error would be smaller than 1%/sqrt(2). You could also use multiple equal-value components in series or parallel for a larger gain to keep the error low, but for a gain of 50 that's impractical, of course. \$\endgroup\$ Commented Feb 19, 2016 at 22:18
  • \$\begingroup\$ Worst case error is not 2% but 1%. \$\endgroup\$
    – Andy aka
    Commented Feb 20, 2016 at 11:22

6 Answers 6

2
\$\begingroup\$

This is a great idea, but if you know anything about statistics when calculating the mean you need to know what your statistical distribution is. Resistor values do not always fit into a normally or uniform distribution. This will make a difference when your calculating the average because you could have a bias.

In layman's terms if you have an 1% error and you sample 10000 parts of a batch of 100 Ohm resistors, you might measure the value of the average to be 100 or you might measure it to be 100.3. (where going to assume that the distribution we picked is a good representation of the entire sample size for simplicity sake) The reason why is because manufacturers don't always guarantee the bias or the distribution. It would be a problem for you because if your desire is to average two values to get a better value, a bias would not help you get closer to the average value. You may be able to find a manufacturer that will have a histogram of resistor values (I think I've seen them in the past), but you are at the mercy of the manufacturer. You could also check the histogram yourself and some people have done that.

\$\endgroup\$
0
\$\begingroup\$

Monte Carlo simulation or the mathematical calculation of probabilities gives better results than worst case analysis, in fact there are very good arguments against using worst case in mass production design. You do need to consider a few issues though. When combining variances, which is where the root of the sum of squares comes from, you are making the assumptions that the variations in the individual numbers are random and uncorrelated. In this case it is likely that your 2 resistors of the same value will be from the sane batch. To be on the conservative side, I would treat them as 1 resistor, as this gives the wider spread. If they were 2 resistors in a potential divider then I would assume they were uncorrelated, as in that case correlation would make the error smaller. You should also consider life time drift and temperature coefficient for the resistors. These effects result from different mechanisms so you can reasonably assume that the contribution from each effect is uncorrelated with the others. For this reason you can take the root of sum of squares for each effect (initial tolerance, temperature coefficient and life drift) within a device.

\$\endgroup\$
0
\$\begingroup\$

The spread of values is rarely random these days. If you pick a 10K pcs tape of 5% resistors say and measure each one you'll find that none ever falls within 1% of nominal value. If manufacturer also offers 2% resistors (less often) the 5% ones will never be within 2%. Also, oftentimes the difference will be on one side, i.e., the actual values are all smaller (or larger) than nominal within a single tape.

\$\endgroup\$
1
  • \$\begingroup\$ If the resistors are different values, they come from a different batch. \$\endgroup\$
    – user16324
    Commented Feb 20, 2016 at 12:27
0
\$\begingroup\$

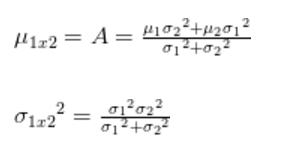
I believe you are thinking of the way gaussian distributions combine (or something similar)
enter image description here

If the resistors are from the same batch, they should have the same mean and variance. In this case you can see the mean would then be completely unchanged. But the variance does something quite interesting. After combining the two gaussians (Which by the Central Limit Theorem is a reasonable assumption to make with a LARGE sample size) you reduce your variance by a factor of 2 (when var(A) = var(B)). But as many others have stated we don't know the exact distribution and there is often a bias in resistors. You may see some reduction in the error, but if all the resistors are biased, you don't move closer to the nominal value, you actually just move closer to the bias.

heres a nice link with math for more than one Resistor, but he seems to arrive at the same conclusion

\$\endgroup\$
0
\$\begingroup\$

I have usually followed the "random walk" (described at a certain Scottish university in terms of the progress of a drunken man!) so I would note that the RMS sum of two 1% errors is neither 0.7% nor 2% but 1.4%

That is, there is a slow sqrt(N) growth in error with increasing number N of uncorrelated error sources, not a reduction in error.

Note this is the opposite of the statistical process you describe, which I think you are applying incorrectly : if you applied increasing numbers N of components to the same error source - e.g. forming a precision resistor from N resistors in series or parallel - you would reduce the error by sqrt(N).

More careful reading of the question : the specific case of splitting the input resistor into two series components falls into the latter case, so the input resistor could be modelled as a 0.7% error source (but see Oleg's answer : the errors are probably correlated).

However the amplifier's gain is still subject to the sum of two independent error sources R1,R2 or (R3+R4), R5.

\$\endgroup\$
3
  • \$\begingroup\$ While the rms sum of 2 1 % (independent etc.) errors is 1.4 %, this is in terms of the absolute variance. The percentage variance does reduce. For instance, 2 100k resistors with 1 % variance in series gives 200k with 1.4k total variance. However, this is 0.7 % of the total 200k. Same thing applies if the resistors are in parallel -- you end with 0.7 % variation on the (50k) total. \$\endgroup\$
    – jp314
    Commented Feb 20, 2016 at 4:43
  • \$\begingroup\$ @jp314 : right, that's exactly what I said - if the two independent sources are connected in series in the same error source the variance does reduce. Now look at R1 and R2 in the schematic above : they are independent error sources - the overall error is increased, not decreased. (Why? Imagine one is high and the other is low. Combined in a single resistor, you get cancellation : in an amplifier the error increases. To which, you object, that if both resistors are low (or high) again you get error cancellation. \$\endgroup\$
    – user16324
    Commented Feb 20, 2016 at 12:21
  • \$\begingroup\$ ... you get error cancellation : True, but the chance of multiple error sources aligning favourably will decrease as the number of error sources increase, therefore error cancellation is the low probability case and error increase is high probability. \$\endgroup\$
    – user16324
    Commented Feb 20, 2016 at 12:25
0
\$\begingroup\$

Actually I don't think resistor tolerance refers to a statistical value. Tolerance refers to the E-series resistor scale. (see Wikipedia) For example, for 1% resistors (E96), there are 96 values in each decade. For example two close values are 2.00K and 2.05K. If we need a nominal value in this range, such as 2.03K, the E scale says there won't be more than 1% error if we choose the nearest available value. In this case we choose 2.05K giving an error of (2.05-2.03)/2.03=.98%

Randomness of the resistor values would add even more uncertainty of course, but I don't know if manufacturers publish mean-squared error data needed for Monte Carlo methods

\$\endgroup\$
1
  • \$\begingroup\$ Any answer that begins with "I don't think" should be a comment at best, certainly not an answer. Besides, tolerance is a statistical value, the E series are designed with that statistical variation in mind. \$\endgroup\$
    – Hearth
    Commented Feb 8, 2019 at 16:50

Your Answer

By clicking “Post Your Answer”, you agree to our terms of service and acknowledge you have read our privacy policy.

Not the answer you're looking for? Browse other questions tagged or ask your own question.