2
\$\begingroup\$

I have been struggling for some time to come up with a meaningful way to test the phase difference between two quadrature channels of an encoder. I have access to a DPO 2014B Tektronix scope and have been trying to come up with a way to make it do what I want, but have had no such luck.

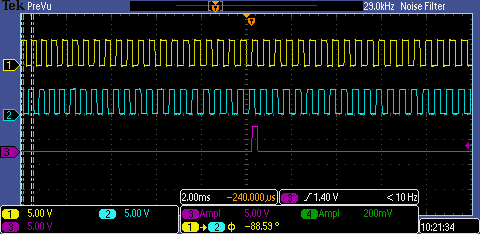
An ideal quadrature encoder should have 90 electrical degrees of separation between any of its subsequent quadrature edges (A high to B high, B high to A low, A low to B low, or B low to A high). Ch. 1 is A and Ch. 2 is B in this case (see below).

EncoderSignals

As we all know, the ideal case typically isn't the observed case. The encoder under scrutiny has a specified edge separation that it must meet and I am interested in measuring the smallest of those to ensure it meets the specification set forth. The encoder has 1024 cycles (so 4096 edges) per mechanical revolution. The third channel contains the index pulse which occurs once per mechanical revolution.

That being said, first let me explain the two methods I have tried so far:

  1. Configure the cursors to the known value for the specification that must be met and physically check each set of edges. This method works, but with so many edges to check is highly impractical.

  2. Use the phase difference measurement of the scope. I had high hopes for this one, but after some back and forth with the support team at Tektronix, found that this actually only measures the average phase difference between the first two pulses on the screen. This is signified in the picture by the two sets of vertical lines to the left of the screen.

I would be fine with not measuring the ABSOLUTE smallest edge separation between all of the edges, but I at least need something that could either come up with an average value, or can sample randomly across the entire waveform.

Does anyone have any ideas? Thanks in advance!

\$\endgroup\$
3
  • \$\begingroup\$ The problem is tougher than you think. Not only might A and B deviate from 90 degrees, but more common is that the square-waves are not 50% duty cycle. A could be 48% while B is 60%, so each of the four combinations of edges can be different. Worse still, they also drift with temperature. I need to use a special algorithm to derive velocity from those squirrelly edges. \$\endgroup\$
    – Mark
    Commented Jul 12, 2016 at 20:24
  • \$\begingroup\$ Yeah, there are certainly a lot of factors to consider. I have a Labview-based system that records every pulse of a full revolution then calculates the shortest phase angle between any two edges. This system works great, however the problem is cost. It is VERY expensive and I don't have the resources to justify dedicating the system to this task alone. \$\endgroup\$
    – cjswish
    Commented Jul 13, 2016 at 14:57
  • \$\begingroup\$ You could try building a phase detector like a PLL would normally use and monitor that signal on the scope. There are various topologies out there depending on your specific needs, I think an XOR gate might suffice here: en.wikipedia.org/wiki/Phase_detector You could also integrate the output of the phase detector and reset during each low cycle; the output of the integrator would rise during the phase mismatch and reset afterwards. So by looking or triggering off of a certain value of this integrators output, you could find the highest phase mismatch. \$\endgroup\$
    – jbord39
    Commented Jul 13, 2016 at 16:02

2 Answers 2

1
\$\begingroup\$

If this is a one-off evaluation, then manually is probably the least worst way to do it. But you could use the scope better to help you. The eye is very good at seeing texture. I suggest changing the display so that a failing edge seperation looks like a change of texture, that your eye can pick out easily from 100 good ones, rather than having to scan vertically between two very offset traces.

Does the scope have a deep memory? It's a Tek, so I imagine it would. Record a whole cycle as a single shot. Then expand the trace and use the time offset control to scroll through it.

Adjust the vertical offset to mostly overlay the traces, then your eye has to do less visual interpolation.

Adjust the horizontal gain so that there is some, but minimal, ideally one pixel, black space between the verticals of the traces. If this space disappears, it should be very apparent as a break in the regularity, a change in the texture, of the pattern.

If it needs to be done more than once, then you must automate. Drive the encoder shaft with a motor.

Off the shelf scopes are all well and good, but you are limited in what they can compute. I suggest using Python on a PC, with matplotlib for graph plotting to see what's happening, to examine the spaces between transitions pulse by pulse. Get your data either with a dump from your existing scope, or use the two channels of a sound card for the two encoder channels, with pyAudio to interface to it. When I needed a phase meter with 0.01 degree resolution for work, I couldn't buy or hire one, so wrote one with Python and a standard sound card on my work PC.

\$\endgroup\$
3
  • \$\begingroup\$ Unfortunately, this is something that will be done many times (possibly hundreds) over the next few years. With that being said, I do like your approach and I will look a little further into your method. It would certainly shorten the process if perfected. \$\endgroup\$
    – cjswish
    Commented Jul 13, 2016 at 14:43
  • \$\begingroup\$ If it needs to be done routinely, then you must automate. Use a motor to drive your encoder. Learn how to program a microcontroller (if you knew how to do this already, you would not have asked this question) like an Arduino or PIC, and use that to capture the time differences between logic edges. The Arduino for instance has capture registers, and libraries for serial communication with a PC, even I can do it! Either that, or a PC sound card, python, pyAudio (PortAudio in a python wrapper), just as easy, done that as well when I needed a phase meter for work. \$\endgroup\$
    – Neil_UK
    Commented Jul 13, 2016 at 15:32
  • \$\begingroup\$ I am in the works writing some Arduino code to timestamp edges and display the minimum edge separation every few revolutions. Can't believe I didn't think of using a microcontroller. I am already using a DC motor to spin the encoder, so hopefully I can get this working soon. Thanks for the advice. \$\endgroup\$
    – cjswish
    Commented Aug 3, 2016 at 19:53
1
\$\begingroup\$

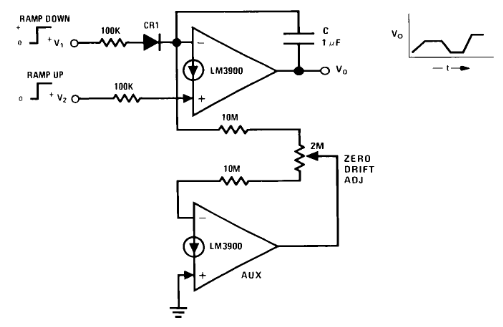
Interesting problem. I suggest a ramp and hold solution. Searching around I found a solution in the LM3900 Norton amplifier datasheet. I have never used these and so can't comment on the likelihood of success.

enter image description here

Figure 85 from the datasheet (page 39).

10.7.2 A LOW DRIFT RAMP AND HOLD CIRCUIT

The input current reduction technique of the previous section allows a relatively simple ramp and hold circuit to be built which can be ramped up or down or allowed to remain at any desired output DC level in a 'hold' mode. This is shown in Figure 85 . If both inputs are at 0 V DC the circuit is in a hold mode. Raising either input will cause the DC output voltage to ramp either up or down depending on which one goes positive. The slope is a function of the magnitude of the input voltage and additional inputs can be placed in parallel, if desired, to increase the input control variables.

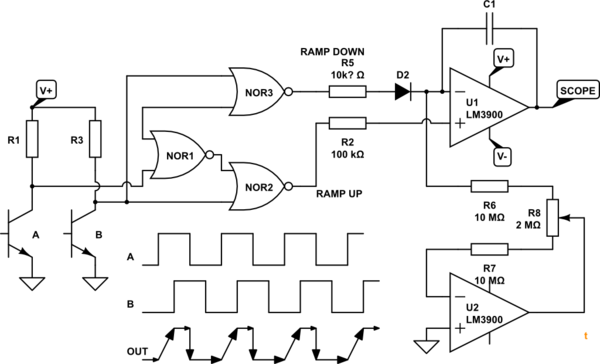
schematic

simulate this circuit – Schematic created using CircuitLab

Figure 1. Suggested glue logic between the A and B phases of the encoder and the ramp and hold.

Differences in phase should show up as differences in height of the plateaus on the OUT waveform.

\$\endgroup\$
2
  • \$\begingroup\$ Interesting stuff. I will explore the possibility of using this circuit or similar. My first thought was actually to use an FPGA to perform the task but I was hoping there was some sort of oscope voodoo that could be performed. \$\endgroup\$
    – cjswish
    Commented Jul 13, 2016 at 14:50
  • \$\begingroup\$ I was also trying to think of some way of doing an X-Y plot as used in Lissajous figures but came up blank. \$\endgroup\$
    – Transistor
    Commented Jul 13, 2016 at 16:02

Your Answer

By clicking “Post Your Answer”, you agree to our terms of service and acknowledge you have read our privacy policy.

Not the answer you're looking for? Browse other questions tagged or ask your own question.