2
\$\begingroup\$

I have designed an 2 stage opamp with all MOSFETs in subthreshold region as shown in the figure below,
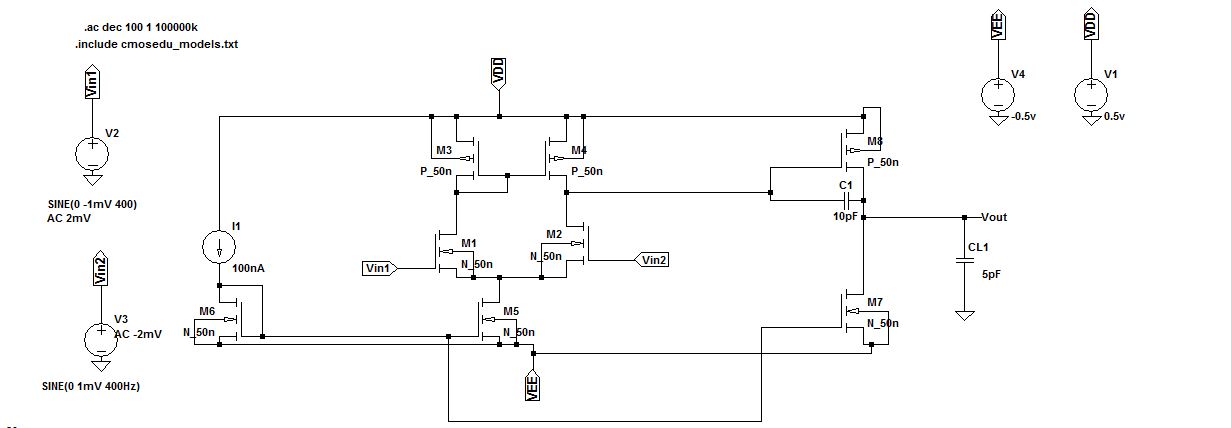
enter image description here I have gain of 48 dB, GBW of 60KHz, Slew rate of 0.014 V/us and Power dissipation of just 0.6 micro Watts.

Here is the Frequency response , enter image description here
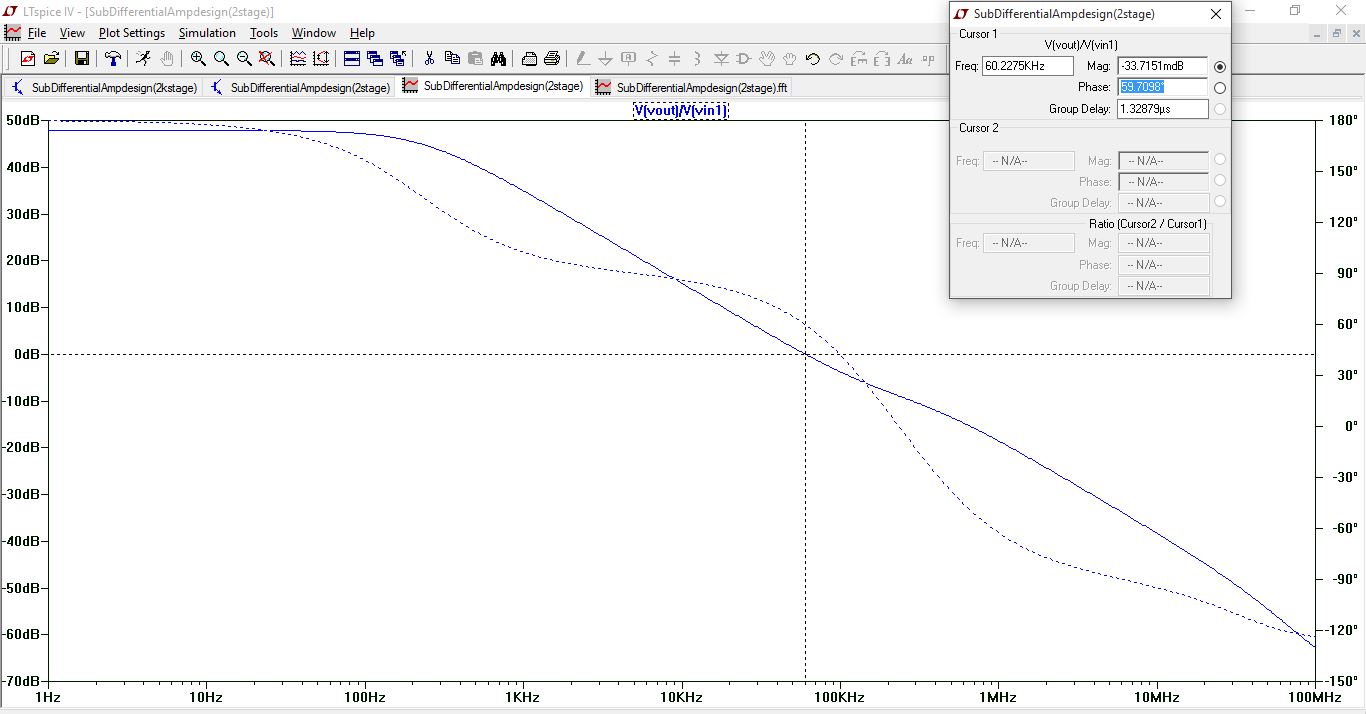
I have a appreciable Phase margin of 60 degrees from the frequency response. I am a little down on noise and harmonic distortion analysis in LT spice.. But i do know that FFT of the output gives an idea of the THD.But how to calculate the percentage harmonic distortion ?

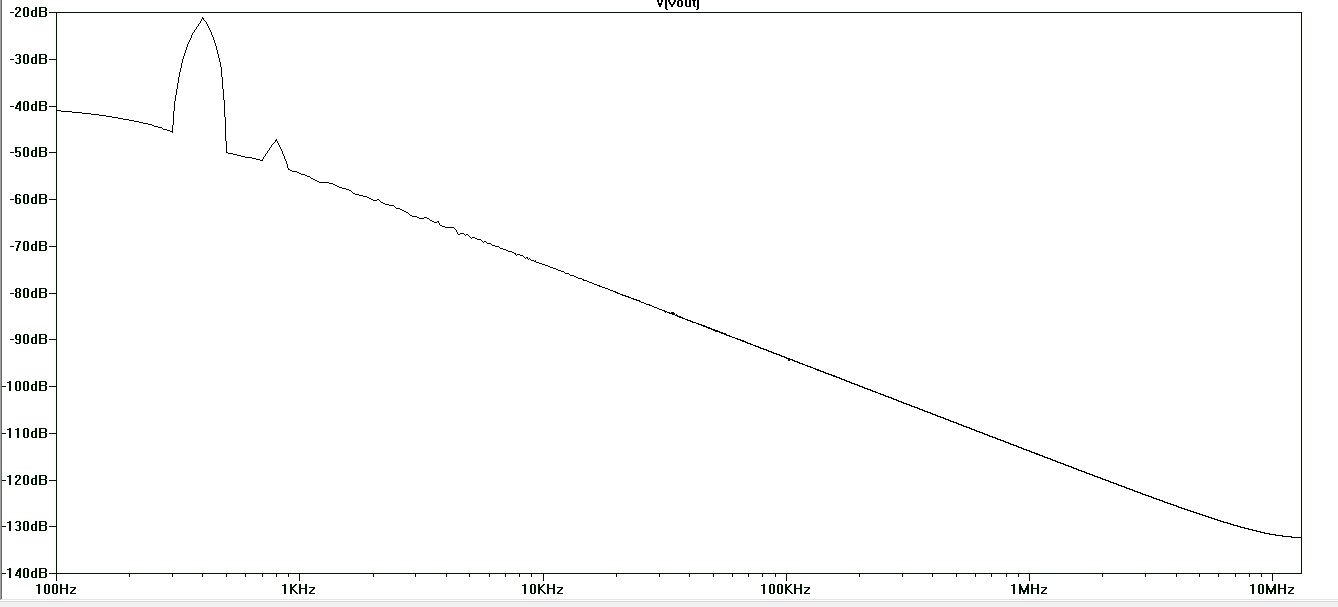
Here is a picture of FFT of the output, (Note :i am operating at 400Hz sine input)

enter image description here

What does this values in db mean and i do see peak at 800Hz which is an harmonic of fundamental frequency 400Hz , what should i conclude from it and how is the THD evaluated?
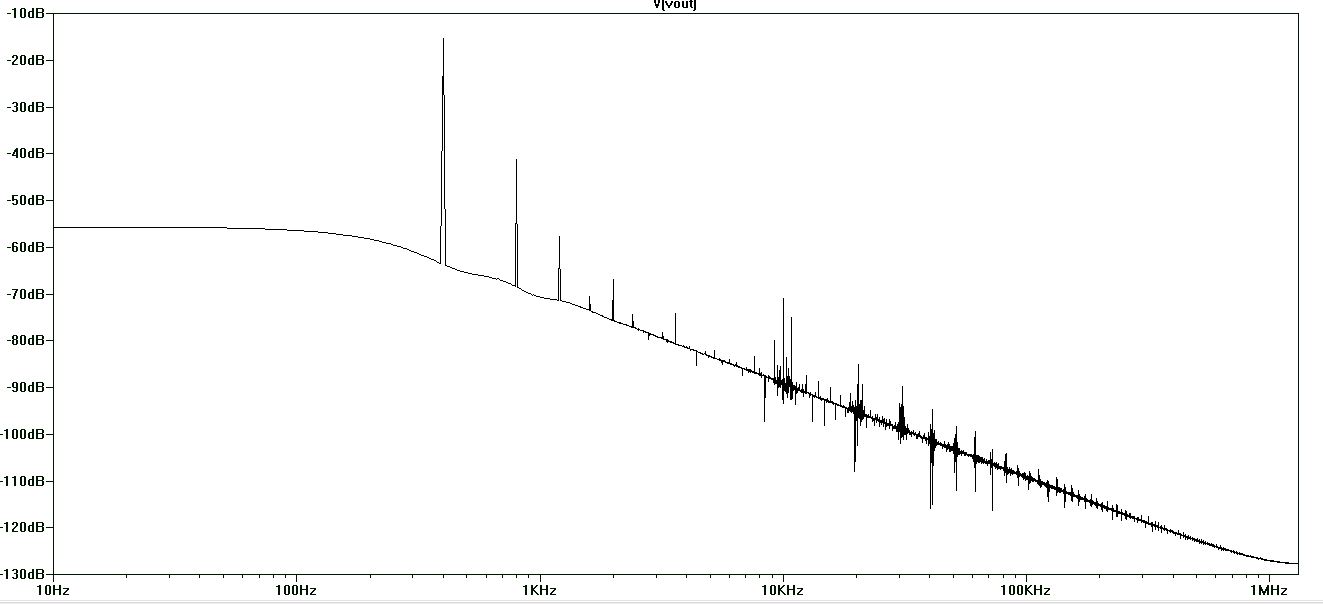
UPDATED FFT PLOT with more cycles as requested by andyaka I would also like to know about the stability analysis of the same.

\$\endgroup\$
4
  • \$\begingroup\$ You have bigger problems with that FFT ... possibly a DC component that is being mistaken as an impulse? That is hiding the other harmonics. You could calculate the 2nd harmonic distortion though. \$\endgroup\$
    – user16324
    Commented Jul 16, 2016 at 15:36
  • \$\begingroup\$ Sir, could you please explain on that. \$\endgroup\$ Commented Jul 16, 2016 at 15:38
  • 1
    \$\begingroup\$ Try using a much finer resolution FFT over many cycles of the input signal. Also, why are you injecting a signal that produces an output that is -20 dBV? \$\endgroup\$
    – Andy aka
    Commented Jul 16, 2016 at 15:59
  • \$\begingroup\$ @Andyaka the circuit is operating at low supply voltage, so maximum positive swing is only around 0.43V and the gain is 48dB. I have updated the FFT with more cycles. please do check \$\endgroup\$ Commented Jul 16, 2016 at 16:49

1 Answer 1

3
\$\begingroup\$

Well, using your much improved FFT you could approximate THD to the amplitude of the 2nd harmonic - it appears to be about -42 dBV and your main signal is at -15 dBV. The 2nd harmonic is therefore 27 dB lower.

As a ratio that is 22.4 times lower or about 4.5 % THD.

If you included the 3rd harmonic at about -58 dBV you have to convert to a real voltage and take the square root of the sum of squares hence, -42 dBV becomes 7.94 mV RMS and -58 dBV becomes 1.26 mV RMS. Now square and add them then take the square root to get 8.04 mV RMS.

Convert this back to dBV to get -41.9 dBV i.e. virtually no difference between using the 2nd harmonic on its own (-42 dBV) but, just for the record the difference is 26.9 dB or a ratio of 22.1 or about 4.52% THD.

In conclusion, unless you have a compelling reason to go any higher I would just approximate THD to the ratio of the 2nd harmonic to the fundamental.

Regards "stability analysis" I'm not sure what you require to demonstrate.

\$\endgroup\$
4
  • \$\begingroup\$ Thank you. is the phase margin good enough please check the frequency response .Also i would like to hear your suggestions on my above work. \$\endgroup\$ Commented Jul 16, 2016 at 17:24
  • \$\begingroup\$ Phase margin of 60 degrees is good. Pretty normal for standard op-amps. \$\endgroup\$
    – Andy aka
    Commented Jul 16, 2016 at 17:26
  • \$\begingroup\$ Thank you, any suggestions on improving my work ? \$\endgroup\$ Commented Jul 16, 2016 at 17:28
  • \$\begingroup\$ It's not an area I have skills in - I use op-amps and don't design them!! \$\endgroup\$
    – Andy aka
    Commented Jul 16, 2016 at 17:30

Your Answer

By clicking “Post Your Answer”, you agree to our terms of service and acknowledge you have read our privacy policy.

Not the answer you're looking for? Browse other questions tagged or ask your own question.