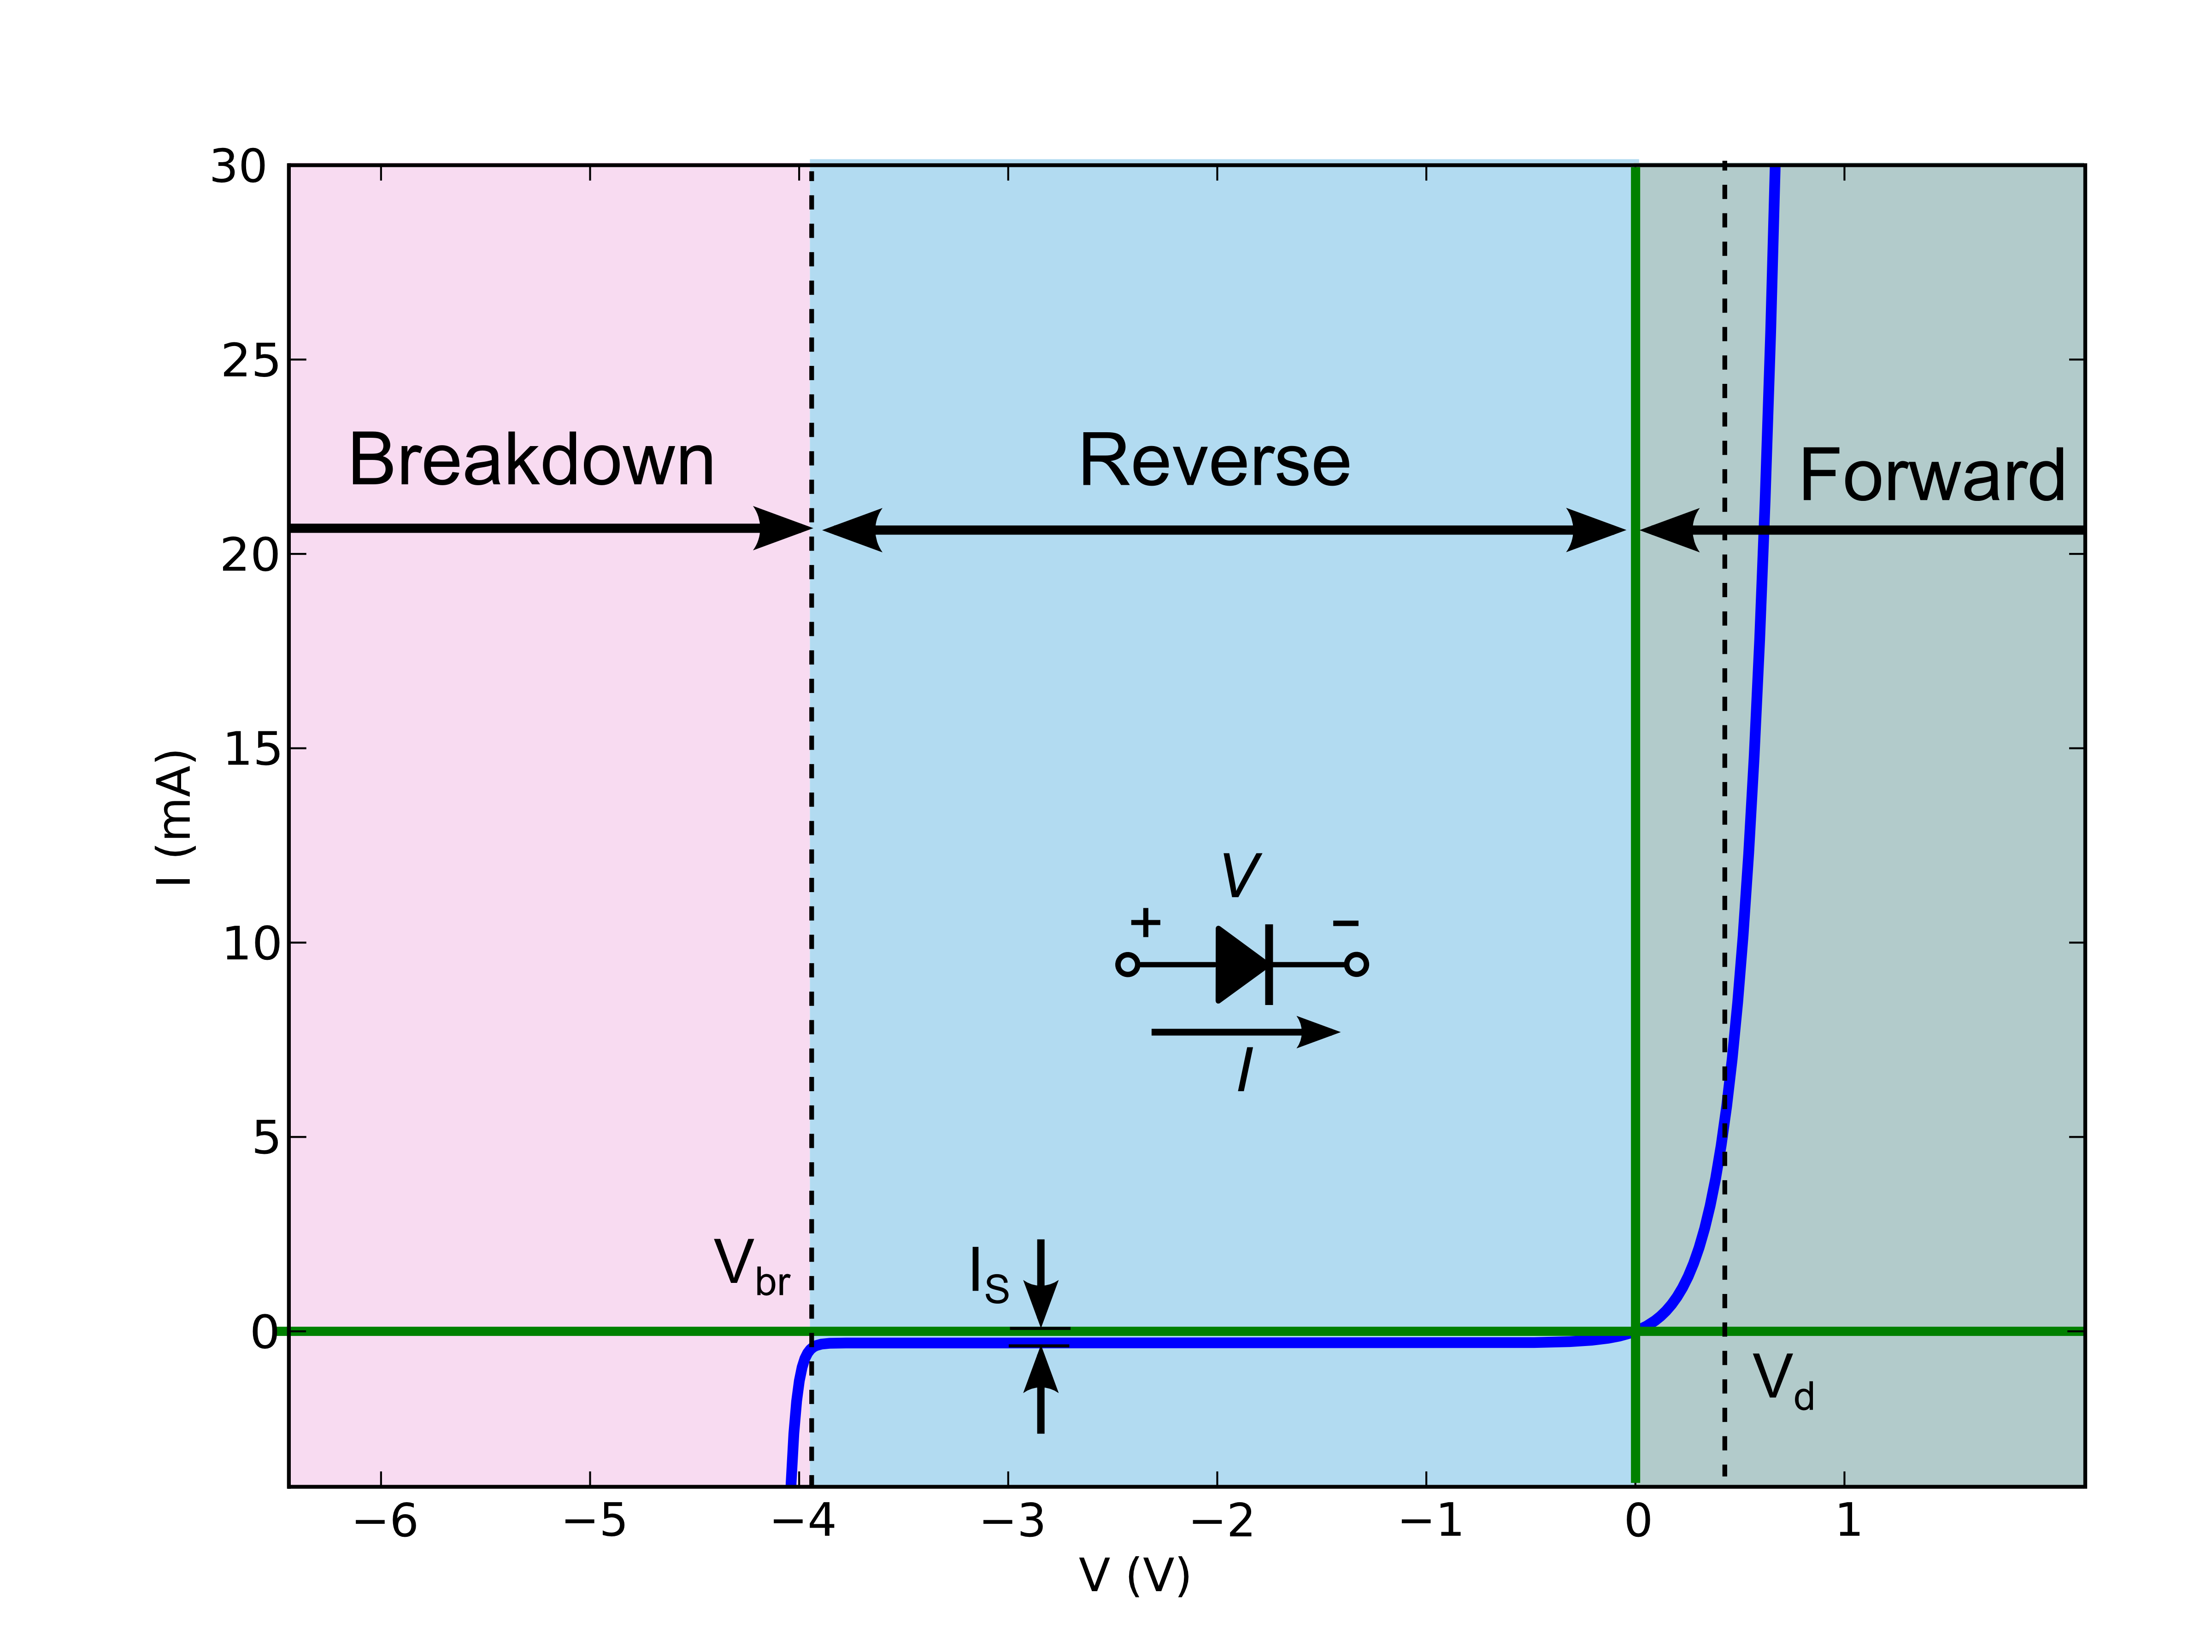
In general, each diode can be approximated with the following equation:
$$ V_I \approx \left[\frac{n\cdot k\cdot T}{q}\right]\cdot ln\left(\frac{I}{I_s}\right)+I\cdot R_s$$
Where \$k\$ is Boltzmann's constant (there are several versions on the web, so make sure your units are correct), \$T\$ is the temperature (usually Kelvin, not Rankin), and \$q\$ is the charge of an electron (usually expressed in Coulombs, but must be consistent with the units used in Boltzmann's constant.) Those are physical parameters independent of the device design. (The value of \$\frac{k\cdot T}{q} \approx 26mV\$ at standard temperature and is commonly called the thermal voltage.) Then you have the model parameters \$I_s\$ (saturation current), \$R_s\$ (the Ohmic resistance), and \$n\$ (emission coefficient.) Those are calibrated to statistical average values used for each device part number (usually.)
You can linearize the above equation by taking the derivative:
$$
\newcommand{\dd}[1]{\mathrm{d}#1}
\newcommand{\d}[0]{\mathrm{d}}
\begin{align*}
\d\left(V_I\right) &= \d\left(\left[\frac{n\cdot k\cdot T}{q}\right]\cdot ln\left(\frac{I}{I_s}\right)+I\cdot R_s\right) \\
\d V_I &= \left[\frac{n\cdot k\cdot T}{q}\right]\cdot\d\left( ln\left(\frac{I}{I_s}\right)\right)+\d \left(I\cdot R_s\right) \\
\d V_I &= \left[\frac{n\cdot k\cdot T}{q}\right]\cdot\frac{\d I}{I}+ R_s \cdot \d I \\
\d V_I &= \left(\frac{n\cdot k\cdot T}{q \cdot I}+R_s\right)\cdot\d I \\
\frac{\d V_I}{\d I} &= \frac{n\cdot k\cdot T}{q \cdot I}+R_s
\end{align*}
$$
That's the effective resistance model of an LED or any other diode. As you can see, it depends on the value of the current, \$I\$.
Here, the emission coefficient \$n\$ is kind of important, as it varies widely for diodes and LEDs. It's nominal value is \$n=1\$. But for LEDs, it is likely to be higher. For example, with an old-style red LED that uses \$I_{FWD}=20mA\$ and operates at \$V_{FWD}=2V\$ the value of \$R_s=21\Omega\$ and so \$n\approx 1.2\$.
A series of LEDs that are of a similar manufacture, you can assume that they all use the same model parameters. So you can multiply the above equation by how many LEDs are in series to get the total effective resistance. It's possible to figure out the parameters by making a few measurements of the voltage across the LED module, doing so at different known currents (and watching out to make the measurements quickly so that the die temperatures are not significantly different.)
Not sure if that helps, at all. But it's an approach to working out a model you can use to predict the behavior and operating points for your LED module.
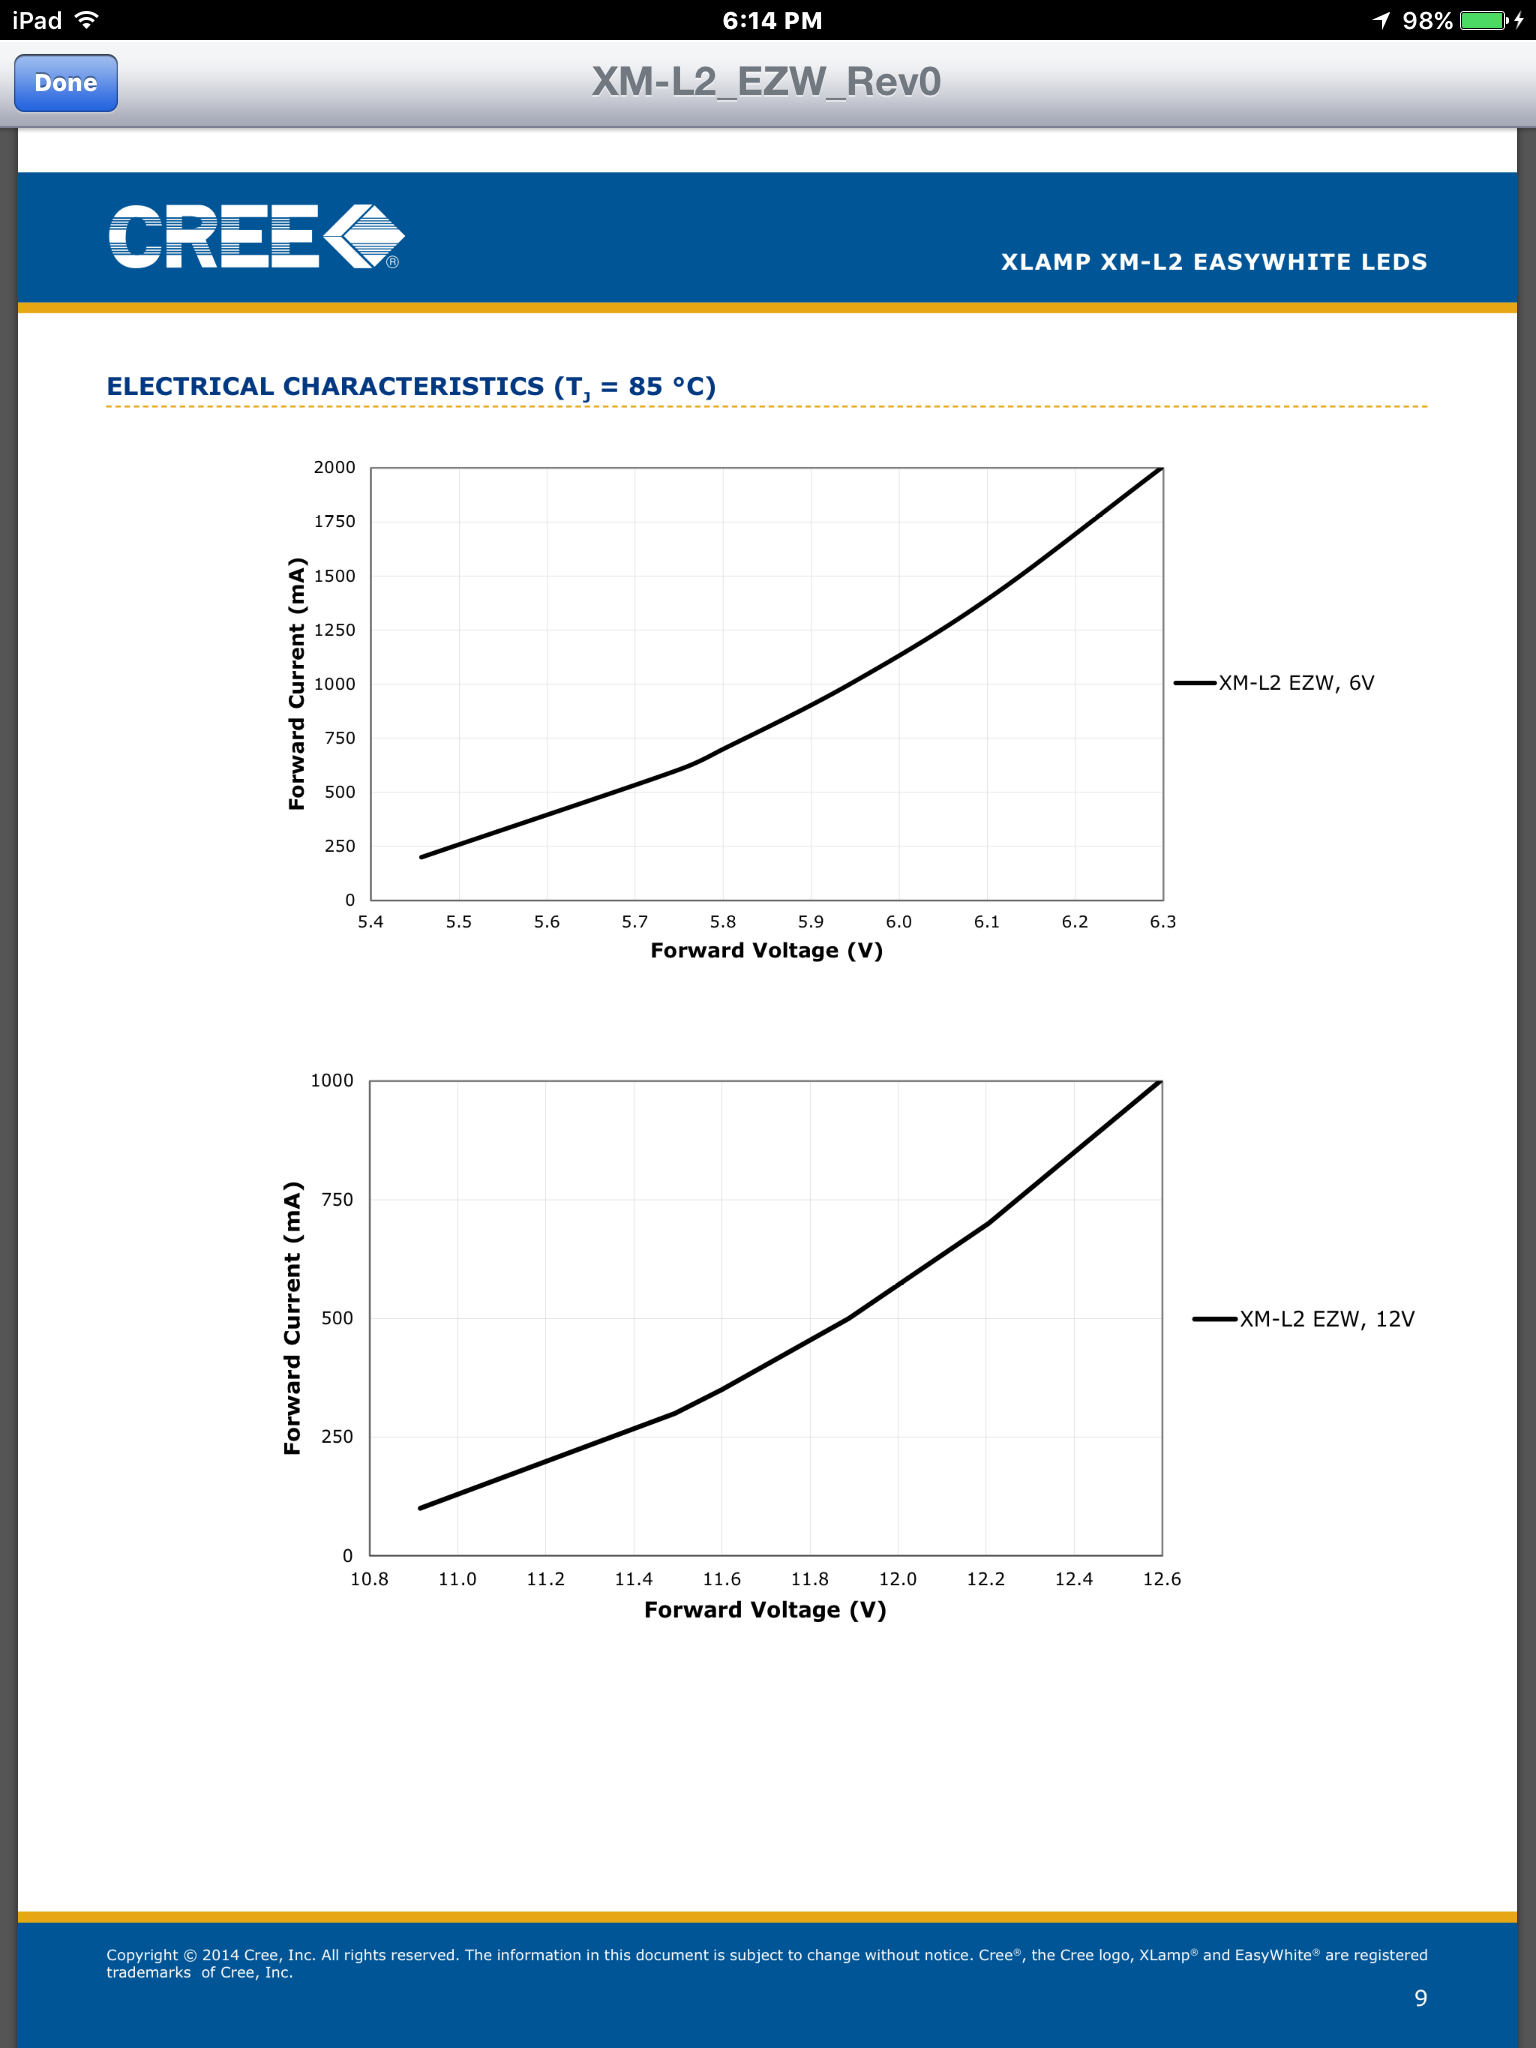
Do take note that the effective resistance varies depending on the current used. So any single value you compute at one current will not apply well if you change the current much. A single resistance value is only good near the operational point you used to estimate it. If you want a better model, you need to use the above method and take a number of (three or more) data points in order to develop an approximation that you can use over a wider range of currents.
Note to @TonyStewart (not a comment to the OP): All V-I curves, by their slopes, represent instantaneous resistance where ever you look. Same with the diode curves. So I take Tony's point about "operated well above the knee of the curve." I just don't take Tony's point, generally. Let's take a look and see why I think Tony's comments below have hand-waved away what are, in fact, important details.
I'm going to call the ohmic resistance \$R_{on}\$, as before, and I'll call the other term the dynamic resistance, \$R_{dyn}\$ (apologies about letter casing):
- A typical red GaAs LED (\$I_s=93.2pA, n=3.73, R_{on}=42m\Omega\$): Note the low value for \$R_{on}\$. This LED will exhibit \$R_{dyn}\approx 4.85\Omega\$ when operated at \$20mA\$ and will exhibit \$R_{dyn}\approx 2.42\Omega\$ when operated at \$40mA\$. Note that \$R_{on}\$ pretty much disappears into the dust. Quite the opposite of what Tony seems to suggest in his comments.
- A typical (other colors than red) GaAs LED (\$I_s=93.1pA, n=4.61, R_{on}=42m\Omega\$): Note that \$R_{on}\$ here is the same (as you might expect from physical considerations) and that \$R_{dyn}\approx 6\Omega\$ when operated at \$20mA\$ and will exhibit \$R_{dyn}\approx 3\Omega\$ when operated at \$40mA\$. Once again, the dynamic resistance is quite dominant. Again, quite different than what Tony suggested in his comments below.
- A typical blue SiC LED: (\$I_s=93.1pA, n=7.47, R_{on}=42m\Omega\$): Note once again that \$R_{on}\$ here is the same (as you might again expect from physical considerations) and that \$R_{dyn}\approx 9.7\Omega\$ when operated at \$20mA\$ and will exhibit \$R_{dyn}\approx 4.86\Omega\$ when operated at \$40mA\$.
My earlier point that the emission coefficient can be very much higher than the usual value of \$1\$ is important. The usual operating points of modern LEDs isn't where Tony imagined them to be. So, quite to the opposite of Tony's comments, the \$R_{dyn}=\frac{n\cdot k\cdot T}{q \cdot I}\$ is actually the dominant term for modern LEDs.
And this also matches my practical experience with LEDs. Their behaviors are, in fact, dominated by \$R_{dyn}\$. So the operating point has almost everything to do with their modeled resistance and it is the case that you only know the resistance for a small region around the measured operating point.
My entire earlier discussion remains, in short.


