3
\$\begingroup\$

I have 2 sinusoidal waves with a frequency of 2 kHz rectified and being sampled at 50 kHz by two ADC channels (10bit) of a PIC18F26K22.

I want to find the measure the amplitude of each sine and the phase difference between each other. I could use ZCD do detect the phase difference and use the adc just to sample the amplitude, but i was looking for a more smarter and all-in-one wide approach.

My question is if the uController has the computational power and if it possible to do a curve fitting with a uController in other to extract those 2 parameters. Getting an ADC with higher sampling rate and resolution is a open possibility, of course.

Edit: To make give my question a context/frame, what i'm looking for is to measure an impedance, i have the signal corresponding to the voltage drop in the impedance and i have another signal corresponding to the current sensing circuit. So I need to sample both to measure each one amplitude and phase difference.

\$\endgroup\$
7
  • 1
    \$\begingroup\$ With 16 MIPS, 64 kB flash, 3.896 kB ram and a hardware multiplier this is well in the realm of feasibility. If you reduce your sampling rate to 10 kHz per channel, you can dedicate 400 instructions for processing each sample. Forget about floating point math, but you can use lookup tables for quickly determining e.g. the sine, inverse sine or exponential function of a value. I would discard the two least significant bits of each sample in order to get each sample to fit in a single byte, allowing for smaller lookup tables and faster processing. \$\endgroup\$
    – jms
    Commented Sep 22, 2016 at 0:12
  • 1
    \$\begingroup\$ Amplitude and phase difference suggests you want to sense a reactive impedance change or a LVDT signal conditioner designed to a certain Class level. Please state purpose and/or the required; 1) resolution 2) accuracy and 3) SNR or spectra of possible noise and dynamic range of signal? \$\endgroup\$
    – D.A.S.
    Commented Sep 22, 2016 at 1:52
  • \$\begingroup\$ the reason I ask is it is trivial to create a precise pseudo sine wave with R weighted ladder from a counter or long shift register. And then it is possible to use an A log DAC to generate a sine wave wave with >70 dB SNR or even possible to use any PC with Audacity to generate a pure sine wave at a fixed level. It all depends what you need to detect? \$\endgroup\$
    – D.A.S.
    Commented Sep 22, 2016 at 2:02
  • \$\begingroup\$ You could construct a digital PLL. This will produce a continuous phase estimate of both signals. Just subtract the two phases to estimate the phase difference. \$\endgroup\$
    – user57037
    Commented Sep 22, 2016 at 9:21
  • 1
    \$\begingroup\$ @TonyStewart, Yes i want to measure an impedance. Namely the electrical conductivity of seawater, which is measured by measuring the fluid impedance between two probes. But i want to sample (measure) a sine wave and not generate it. My signal conditioning is a current sensing and a volt measurement, both output two sine waves with same frequency but different phase. The impedance resolution i'm looking is: 0.1 ohms and can have an accuracy of +/- 5%. This translates in voltage as something as 1mV accuracy and +/-5%. Does my information helps ? \$\endgroup\$ Commented Sep 22, 2016 at 10:18

5 Answers 5

2
\$\begingroup\$

I have no clue why you want this stuff. And Tony is asking and you aren't answering. So I'm just going to take you literally and answer that.

A general method to find the phase difference between two identical signals is to use a correlator. This works even for speech and music. In the digital domain, just cross-correlate them. The local maximum in the correlation function will be at the time delay \$\delta\$. If you have a reference signal, you can just correlate against that one, too. Correlation is dead easy, too. You can find a very simple routine for it just about anywhere you look. Just a few lines of code, really.

There's an old paper from 1963 called "The Quefrency Analysis of Time Series for Echoes: Cepstrum, Pseudo-autovariance, Cross-Cepstrum, and Saphe Cracking" by Bogert et al. You might find it worth reading, as well.

\$\endgroup\$
6
  • 1
    \$\begingroup\$ I too am fond of the "rahmonic liftering" methods used in that paper. \$\endgroup\$
    – D.A.S.
    Commented Sep 22, 2016 at 12:49
  • \$\begingroup\$ @jonk i like your idea, but can i still do this if i sample the two different waves at different moments ? \$\endgroup\$ Commented Sep 22, 2016 at 13:40
  • \$\begingroup\$ That should just give you a small, fixed phase offset which you can subtract out. \$\endgroup\$
    – pjc50
    Commented Sep 22, 2016 at 14:10
  • \$\begingroup\$ Correlation is essentially a convolution. It requires a number of multiply-accumulates each sample. It may be mathematically simple and simple to describe, but it will take a lot of cycles, especially for a PIC 18 that doesn't have multiply-accumulate hardware. \$\endgroup\$ Commented Sep 23, 2016 at 11:06
  • 1
    \$\begingroup\$ @NicholasTJ If I didn't have a copy, I'd probably go to the library. The full citation is Bruce P Bogert, Michael JR Healy, and John W Tukey. The Quefrency Analysis of Time Series for Echoes: Cepstrum, Pseudo-Autocovariance, Cross-Cepstrum and Saphe Cracking, Proceedings of the Symposium on Time Series Analysis, volume 15, pages 209–243, 1963. I don't know if a DOI was assigned. But the proceedings is a published work so it should be available in print, somewhere. \$\endgroup\$
    – jonk
    Commented Nov 26, 2019 at 20:33
2
\$\begingroup\$

You can do this with the PIC, but it would help greatly to start with the right hardware in front of the A/D. Rectifying the signals is a bad idea. That makes it harder to find both the amplitude and phase. AC couple the signals and add a DC bias of ½ the A/D range. Scale it so that the maximum amplitude doesn't quite hit the min and max limits of the A/D range.

You can use the two 50 kHz sample streams to find both the amplitudes and the phase between the signals.

If you know both signals are really sines, then the amplitude can be derived from the average difference from the long term average. Heavily low pass filter each signal to get the DC component. Subtract each reading from this DC component, then take the absolute value of it and average that. The result will be proportional to the amplitude. Again, this only works if you know the signals are sines (low harmonic content).

To find the phase shift, detect the zero crossings. Look for the first positive reading after having seen some minimum number of negative readings in a row, for example. Each cycle of one of the signals, compute how many cycles back the last time the other had a zero crossing. There will probably be some noise on this signal, not the least of which is quantization noise. At 50 kHz sample rate, you have only 25 samples per cycle. Low pass filter this 0-24 number with a few extra bits below the binary point. It will help if the sample rate is not a exact multiple of the frequency of interest.

If the above still yields too much quantization noise, then interpolate between the two samples where the zero crossing occurred to determine it more accurately. This will take more computing cycles.

All in all, I would do this with one of the 16 bit PICs or dsPICs with a 12 bit A/D. The 18F26K22 seems like a strange choice for this. A 16 bit part would allow for low pass filtering the incoming streams before doing anything else with them, and the 12 bit A/D gives you better sampling resolution to start. That should allow true RMS measurement (although that may not be necessary), and allow for more cycles to do a better job of finding the zero crossings, allowing better phase measurements.

\$\endgroup\$
1
\$\begingroup\$

Design plan: (measure impedance of seawater)

  • frequency of 2 kHz
  • The impedance resolution: 0.1 ohms
  • accuracy of +/- 5%.
  • This translates in voltage as something as 1mV accuracy and +/-5%.

Water:

  • dielectric constant of 80 +/-10%
  • conductivity : Its units are Siemens per meter [S/m] in SI and millimhos per centimeter [mmho/cm] in U.S. ( not recommended)

Read more: http://www.lenntech.com/applications/ultrapure/conductivity/water-conductivity.htm#ixzz4KzOtwJlE

  • (Trivia: ultra pure water is not a healthy drinking fluid due to the absence of healthy dissolved minerals.)

  • Total Dissolved Solids (TDS) and Electrical Conductivity (EC) are almost equivalent as the number of dissolved ions is what makes water conductive.

  • Ultra pure water 5.5 · 10-6 S/m

  • Drinking water 0.005 – 0.05 S/m
  • Sea water 5 S/m

Read more: http://www.lenntech.com/applications/ultrapure/conductivity/water-conductivity.htm#ixzz4KzOEKC3V

  • Background experience

Typically precision LCR meters measure impedance using an autoranging constant current frequency source at a fixed frequency such as 120Hz, 1kHz, 100kHz, 1MHz and then measure directly voltage to obtain the resistance and reactive components and other parameters.

Precision highly sensitive instrument designs will use a dual PLL to improve signal to noise ratio (SNR) and thus resolution of 10 ppm is possible { which I have achieved in eddy current designs for detecting metallurgic flaws} relative to a normalized values (auto-zero)

This is not a solution, nor a comment but rather reference info to choose a better instrument design plan or a better question. Electrode size and materials are also an important aspect of this design as corrosion may influence sampling test repeatability.

I'll let you decide if this is helpful.

\$\endgroup\$
3
  • \$\begingroup\$ Hello Tony,i already knew this and i don't see how it helps how to do a curve fitting of two signals in a microcontroller. Thank you for help. \$\endgroup\$ Commented Sep 22, 2016 at 13:31
  • \$\begingroup\$ Curve fitting is not how I would measure reactive impedance. There are better methods for phase and amplitude detectors. \$\endgroup\$
    – D.A.S.
    Commented Sep 22, 2016 at 13:40
  • \$\begingroup\$ Ok, so can you give me a hint of what would be your approach ? \$\endgroup\$ Commented Sep 22, 2016 at 13:43
1
\$\begingroup\$

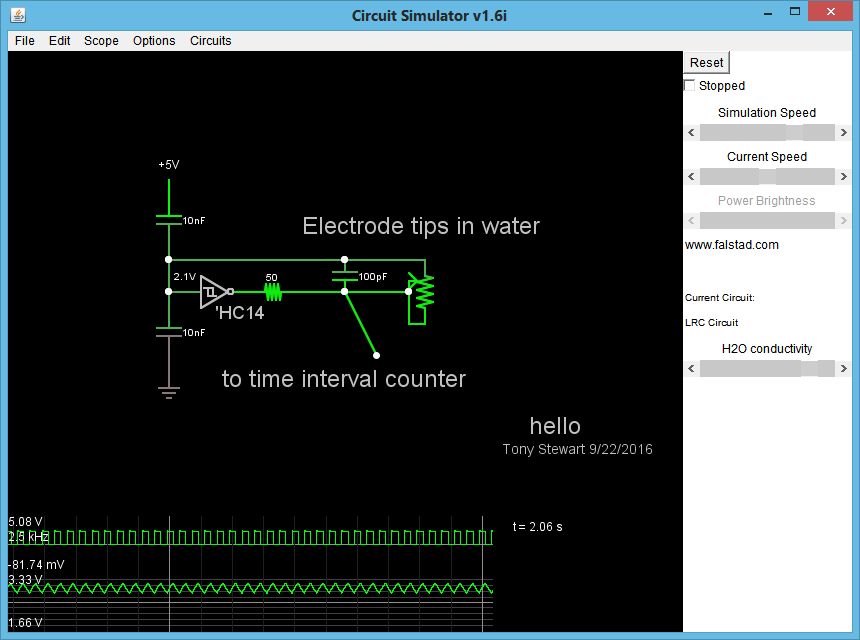
Proposed solution Relaxation Oscillator Time Interval > 2KHz

Since conductivity of water is dependent on water temperature, this may be measured with temperature sensor IC for lookup table correction w.r.t 20'C.

The dielectric constant of water is 80+/-5 and the electrode capacitance will depend on surface area and gap of the electrodes. For this to work effectively, we want to make C of water much less than a precision C value in the circuit, to effectively ignore Cwater and only measure conductivity in Siemens/meter Therefore short electrodes with a precise gap are required.

It is also known by some researchers ( citation needed) that contaminated water can begin ionization and coating the electrode surface with DC within 1 ms, if greater than 1.5V thus a frequency >> 1KHz is desired.

The method proposed here uses the resistance of water to charge up a precision low leakage capacitor for a relaxation oscillator. The principle of all Schmitt Trigger designs is to ignore noise inputs, but in this case it is to generate a clock with negative feedback and the built in threshold of 1/3 to 2/3 has a wide tolerance, so a precision Comparator with R Ratio feedback 3:1 is preferred with accuracy dependent on the resistor ratio tolerance and values.

Design details

  • C >>100x C of electrodes.
  • C is split in half to Vcc and Vdd so that the startup of oscillator is instant with V/2 at the input. (optional)
  • C value is chosen withe electrode shape and gap to produce f>2kHz
  • T=RC is normally done at ~60% of a 5V half cycle triangle wave.

    • This is only 1/3 swing at Schmitt Inverter input, but can be made (discrete full swing Op Amp) to be exactly 30% hysteresis, if RC=T=1/f was desirable for some reason.
  • 50 Ohm output is the internal impedance of HCxx gates @ 5V approx. is shown for clarity.

    • Comparators with open collector require a pull-up R. which affects thresholds. Rail to rail is desired to a stable or at least calibrated 5.00V regulator

Java Falstad Simulation

screen shot below enter image description here

\$\endgroup\$
0
\$\begingroup\$

You could also apply the FFT to both signals and extract the amplitude and phase using the component with bigger amplitude.

For the phase you could also do the zero cross detection and not curve fit the whole signal but only near the zero, where it is almost linear (sin(theta) is aprox. theta for small theta)

\$\endgroup\$

Your Answer

By clicking “Post Your Answer”, you agree to our terms of service and acknowledge you have read our privacy policy.

Not the answer you're looking for? Browse other questions tagged or ask your own question.