1
\$\begingroup\$

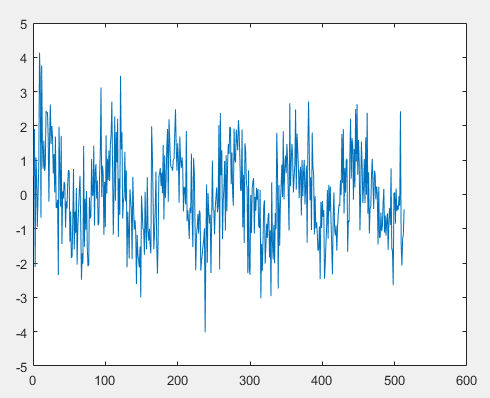
I have a dirty sine wave at about 8 Hz, and I want to figure out the SNR using MATLAB.

Would a reasonable approach to answering this question be to generate a clean 8 Hz sine wave in MATLAB and then use that to compare to the dirty signal to find the SNR? My thinking is that the clean sine wave is the ideal we would want.

I am not sure if there would be any phase issues in doing this.

I know MATLAB has an snr function, but I would like to be able to calculate it to compare to the function.

As a reference, the signal with noise could look something like this

enter image description here

\$\endgroup\$
4
  • 3
    \$\begingroup\$ Take an FFT of the combined signal, then compare the value of the 8 Hz to the other components. \$\endgroup\$ Commented Jul 1, 2017 at 21:00
  • 2
    \$\begingroup\$ Well, the PSD estimate done with |FFT|² is one spectrum estimate, but certainly not what you'd optimally do to detect the power of a single tone. Go for a parametric spectral estimator, and compare tone energy to overall energy – Parseval's theorem states that the sum of energy in all FFT bins is identical to the sum of energy in all time samples. \$\endgroup\$ Commented Jul 1, 2017 at 22:33
  • \$\begingroup\$ What do you mean by 'dirty sinewave'? Is it supposed to be modulated in some way? If so, then you need to look at the desired signal bandwidth and use the width of this to define the SNR. If your bandwidth is unbounded/undefined, then SNR is rather meaningless. \$\endgroup\$
    – Jon
    Commented Jul 2, 2017 at 9:23
  • \$\begingroup\$ By dirty, I mean that there is noise added to the signal. This noise will come from a number of sources, and there is little I can do about removing it at the minute. \$\endgroup\$
    – ofithch79
    Commented Jul 2, 2017 at 12:20

2 Answers 2

2
\$\begingroup\$

Start with the definition of SNR, signal power to noise power ratio.

Take an FFT of your waveform. Classify each bin as containing signal or noise. Sum the power in all the signal bins to get signal power. Sum the power in all the noise bins to get noise power. Take the ratio.

You have some choices about how you set up the FFT, and how you classify the bins around the signal frequency. Do you use a window, and if so which one, and what does it do to the signal, and what does it do to the noise?

Parseval's Theorem is very useful here in getting one's ideas straight. Obviously a synchronously sampled signal that allows you to avoid a window and still convert without aliasing is the simplest situation to understand first.

MATLAB is very handy for this sort of task, as you can generate known signals with known noise additions, analyse them, and check you get the answer you expected. Hint, seeing noise on a graph is rather easier than understanding exactly what the noise measurements mean quantitively. It's worth comparing with MATLAB's SNR function, but you'll need to understand exactly what choices it is making for the signal classification.

\$\endgroup\$
2
  • \$\begingroup\$ Hi, thanks for your reply! It is very interesting. I am just wondering about when you say to classify a bin as either signal or noise. Is this done visually? I am wondering because looking at the signal, you can see the underlying sine wave, but there is noise on top of it. I was trying to include an image, but I can't in the comment, so I will try and add it to the original question. Thanks. \$\endgroup\$
    – ofithch79
    Commented Jul 2, 2017 at 12:24
  • 1
    \$\begingroup\$ @o.fithcheallaigh if you synchronously sample and dispense with a window, then the single bin at the signal frequency represents the signal power, and all else is noise. If it's not, the power will spread to adjacent bins, either to just a few bins under your control with a window, or to many not under your control if you don't use a window. These additional bins also contain signal power. One of the Blackman-Harris family of windows (so Hamming, Blackman, Blackman-Harris) is usually best for SNR estimation, as they have a finite spread of signal power. Wikipedia window_function page FTW. \$\endgroup\$
    – Neil_UK
    Commented Jul 2, 2017 at 14:03
0
\$\begingroup\$

Your oversampling ratio defines the noise bandwidth, as show below:

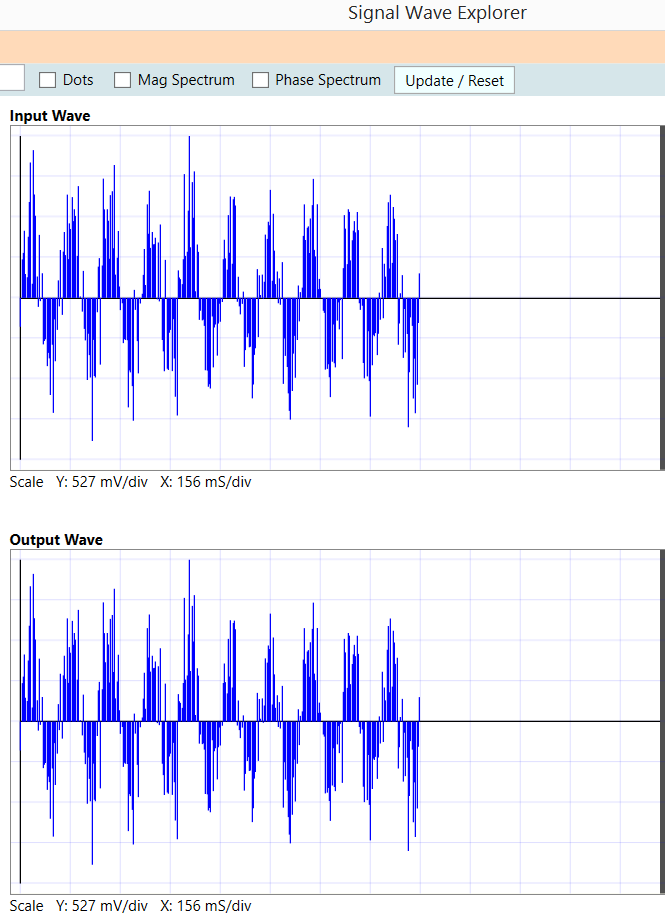
8Hz, with 32 samples per cycle, and 10dB SNR computed in Nyquist bandwidth enter image description here

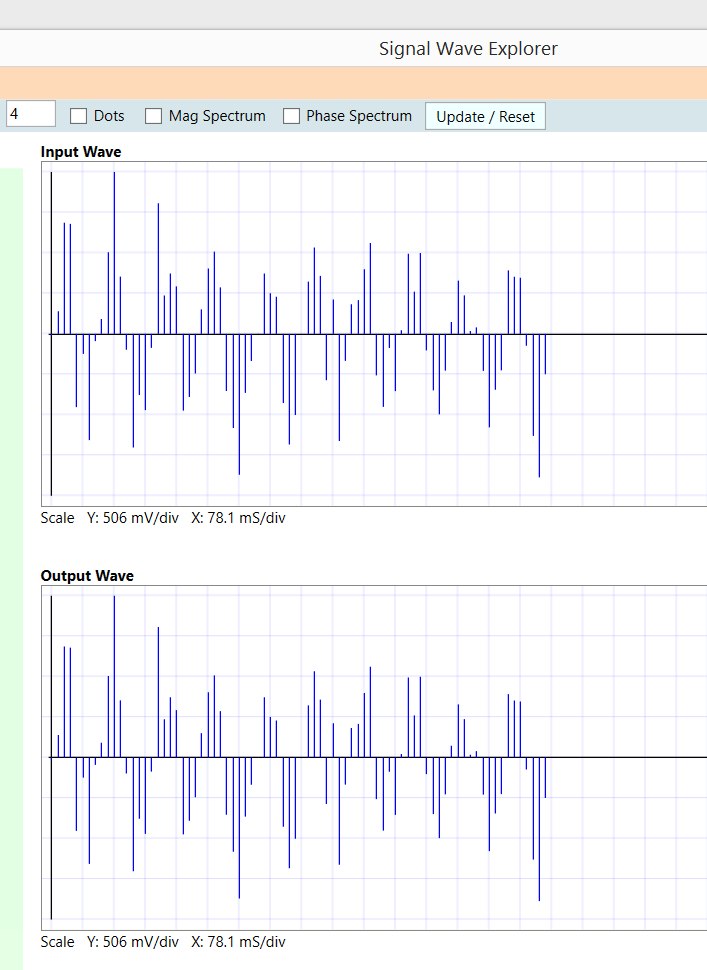
In contrast, here is 8Hz, with 8 samples per cycle, 10dB SNR computed in that Nyquist bandwidth

enter image description here

\$\endgroup\$

Your Answer

By clicking “Post Your Answer”, you agree to our terms of service and acknowledge you have read our privacy policy.

Not the answer you're looking for? Browse other questions tagged or ask your own question.