4
\$\begingroup\$

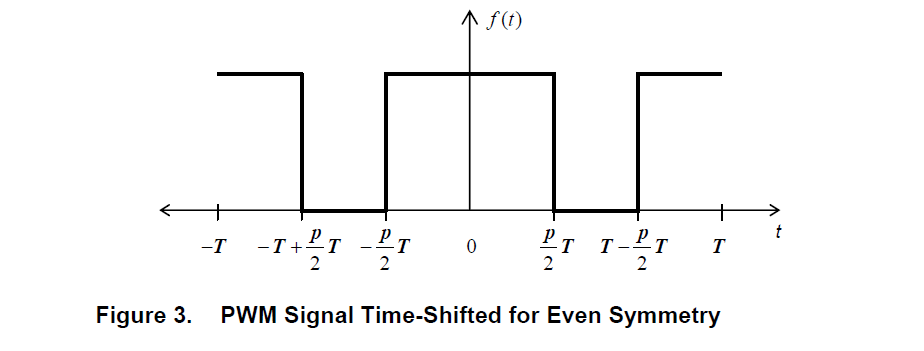
I have been doing some research into the fourier analysis of square wave signals for my project which involves filtering of PWM signals. Just a few things online that I have found which don't make sense to me which hopefully somebody could clear up. First off this document by Texas instruments discusses the Fourier coefficients of a PWM signal with duty cycle pT. The image of the signal in the example is shown here:

enter image description here

And so the text goes on to to discussing the derivation of the Fourier coefficients of this signal using first principles.The formulas along with their results are shown in the next image: enter image description here
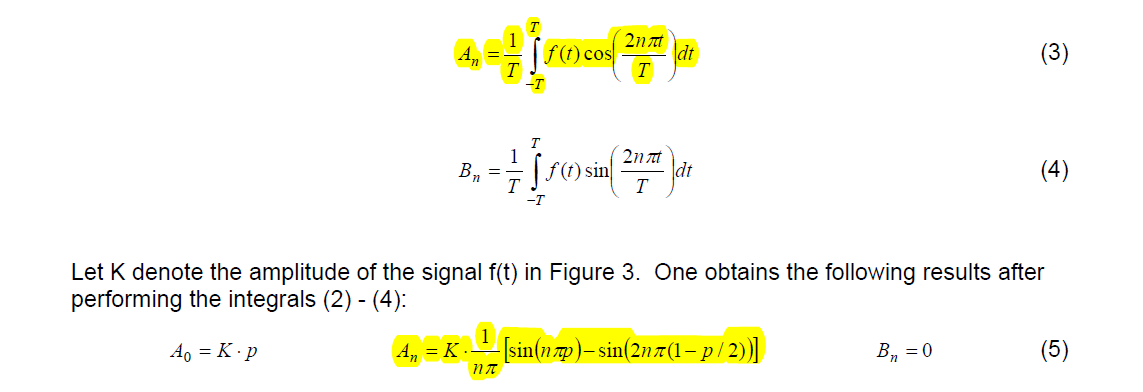
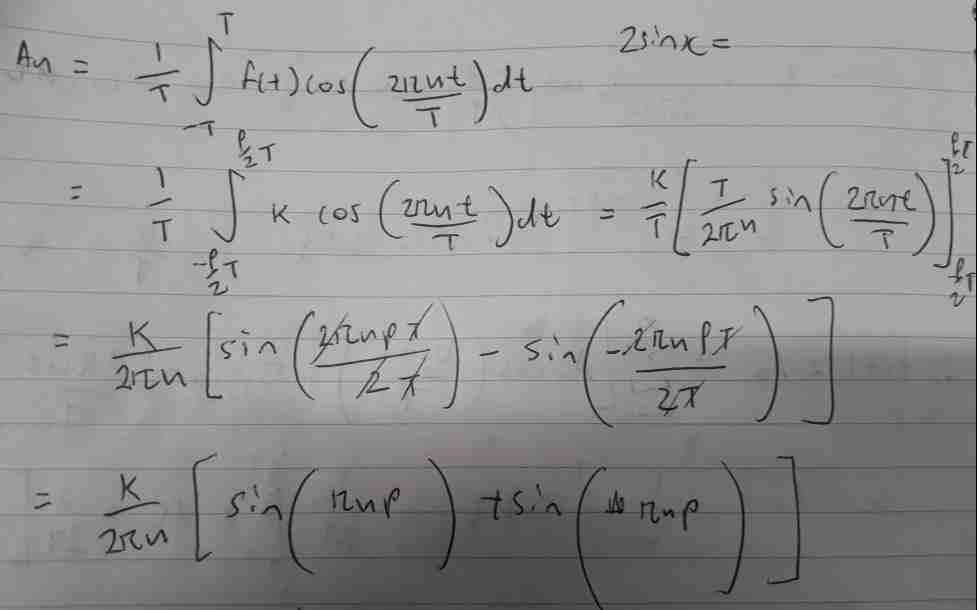
The problem I am having here is that I cannot evaluate the highlighted integral and get the same expression for the A sub n terms. When I do it taking the limits from \$\frac{-pT}{2}\$ to \$\frac{pT}{2}\$ I get \$\frac{K}{n\pi}[\sin n\pi p]\$. Could somebody evaluate this integral and show me how they got this.

Here is my attempt to evaluate it: enter image description here
Also this document says that the fourier series is a sequence of higher end frequencies stretching out on both sides of the fundamental frequencies which are integer multiples of the fundamental frequency. The coefficients are the amplitudes of these frequencies on the frequency spectrum. I cannot find any formula that explains why these harmonics are integer multiples of the carrier frequency.

This online tutorial for example I can't get my head around. Here is the image of the square wave upon which a fourier transform is performed: enter image description here
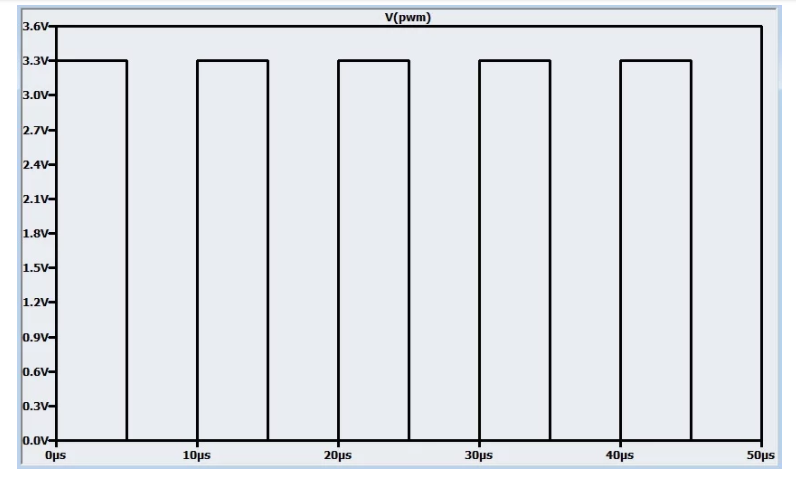
As you can see the frequency of this square wave is 100KHz. But then when the Fourier transform is performed you get given this image of the signal in the frequency domain: enter image description here
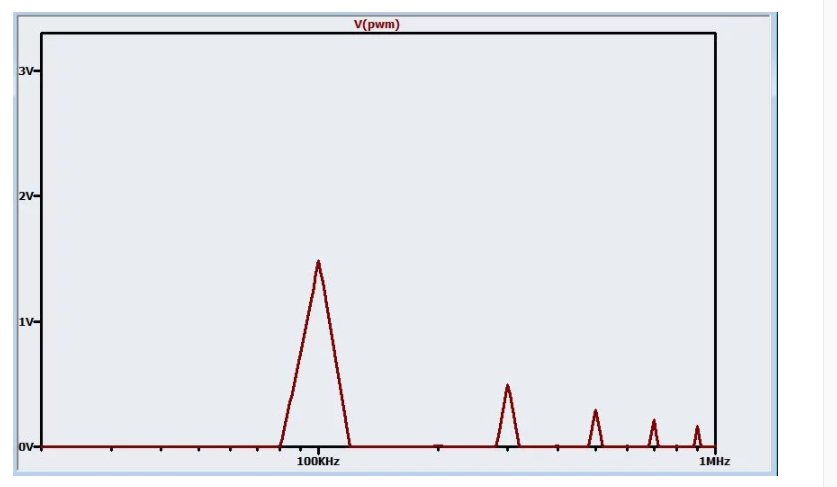
Could somebody explain/show why this signal has frequency components at what I believe are 200kHz, 400kHz, 600KHz, and 800KHz. I understand its central DC component of 1.65V but other than that I don't get this.

Thanks in advance,

Simon.

\$\endgroup\$
6
  • 1
    \$\begingroup\$ When you say "I cannot evaluate the highlighted integral", does it mean you don't know how to integrate or that you don't get the same result as in the textbook? \$\endgroup\$ Commented Apr 20, 2018 at 6:36
  • \$\begingroup\$ I don't get the same result shown in (5). \$\endgroup\$
    – burton01
    Commented Apr 20, 2018 at 6:56
  • 1
    \$\begingroup\$ If you look at the x axis labels for your last image, you'll see the components are at 100kHz (fundamental), then 300k, 500k, 700k etc (the odd harmonics). Remember it's a log scale, but sub-divided linearly within each decade. \$\endgroup\$
    – Neil_UK
    Commented Apr 20, 2018 at 7:45
  • \$\begingroup\$ @burton01 Then could you include the results you get in your question? Perhaps someone will be able to spot an error there. \$\endgroup\$ Commented Apr 20, 2018 at 8:30
  • \$\begingroup\$ sure @DmitryGrigoryev edited the question just now. \$\endgroup\$
    – burton01
    Commented Apr 20, 2018 at 10:27

3 Answers 3

1
\$\begingroup\$

There's a lot going on here, but I'll try to give bite-size takes.

Those Fourier series coefficient equations are wrong

Unless you're using a different FS than what I would call standard, there should be a factor of 2 in front of both the \$A_n\$ and \$B_n\$ definitions.

You evaluated the integral correctly

The equation they give in (5) is wrong. I'm not sure where you found this resource, but it wouldn't hurt to check a different one (this problem of analyzing square waves using Fourier Series is super-common in engineering textbooks on the matter).

Why do we only need harmonic frequencies?

This one is tougher without knowing your math background. One important thing to recognize is that then \$n\$-th harmonic frequency has a period of \$T/n\$, but more importantly, a sinusoid at the \$n\$-th harmonic frequency repeats itself exactly \$n\$ times every \$T\$ seconds. Because of this exactness, we can make the edges of the period of the reconstructed signal line up where we want them.

Consider the following progression to recreate your 50% duty cycle PWM signal.

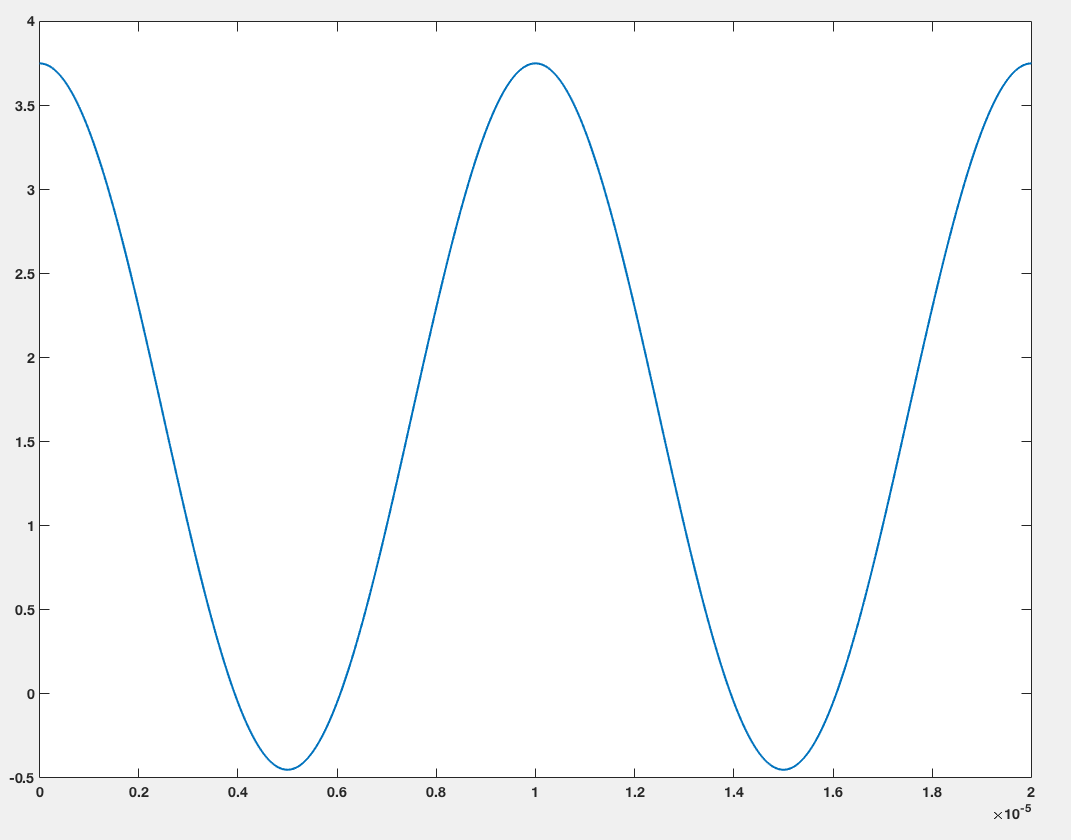
Take only the \$A_0\$ and your \$A_1\$ term (multiplied by the factor of 2 I mentioned). If you plot the resulting (synthesized) time domain function $$y_1(t) = A_0 + 2A_1\cos(2*\pi*t/T)$$ you get enter image description here

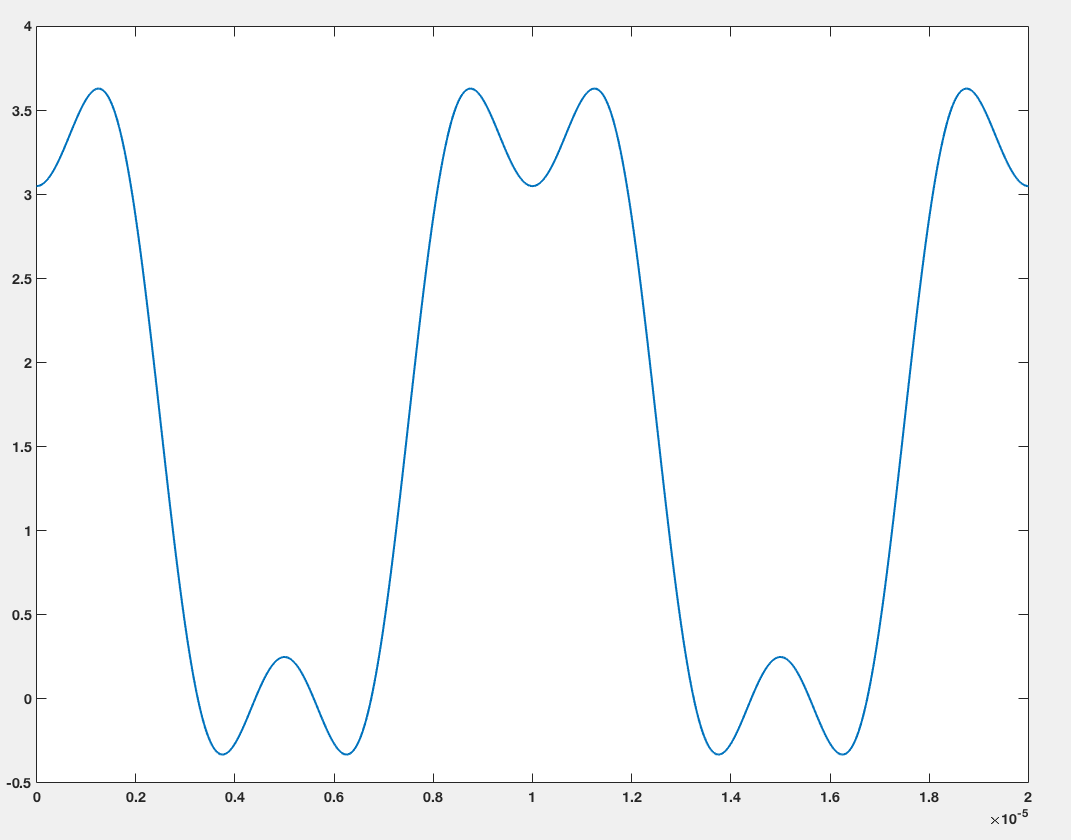
If you add the next nonzero harmonic, you get

$$y_3(t) = y_1(t) + 2A_3\cos(2*\pi*t*3/T)$$

which looks like

enter image description here

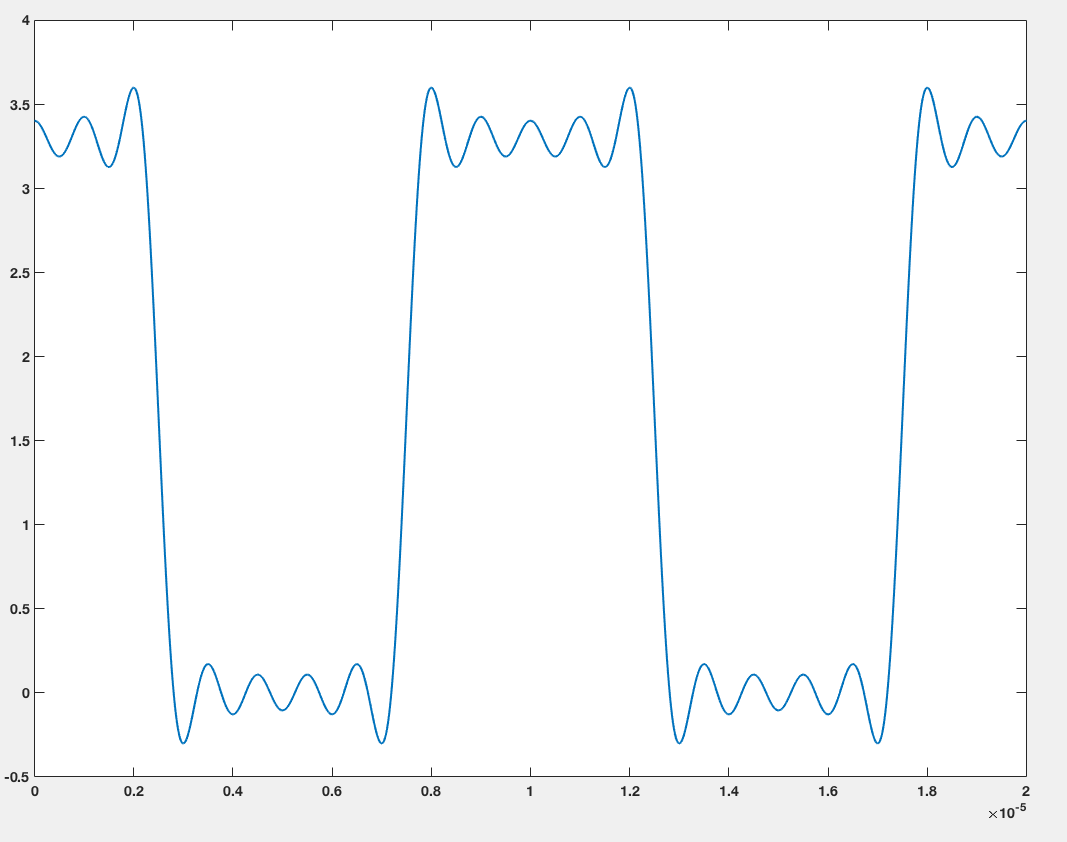
If you keep going up to \$n=9\$ you get a pretty good approximation of the original square wave:

enter image description here

\$\endgroup\$
0
\$\begingroup\$

The Fourier coefficients are, in every case, just a computation of CORRELATION between the input waveform and the sin/cosine basis functions.

Hint Hint--- "harmonics" are a mathematical contrivance.

Think what new design freedom you have, what bandwidth of circuits (poor correlation), you may acquire if you debate the existence of "harmonics".

=======================================================

Example: you have a MCU with 10MHz clock, with 1nanosecond ramp_edges on the clock. That 1nS ramp_edge produces correlation of sin(X)/X energy shaping, with the first null out at 1,000MHz, the 2nd null at 2,000MHz..

Now on that same die with the MCU, implement a radio receiver. Should you pick 310MHz as the carrier (exactly the 31rst integer multiple of the MCU clock) or pick 313MHz (which is 31.3X MCU clock)?

How do you decide?

Now let me also tell you that the input PI matching, from antenna to Low_Noise Amplifier, has Q of 10 for easy manufacturability given component tolerances.

How do you decide on the Carrier frequency?

Given the Q (bandwidth being 313/10 == 31MHz widh or +-15.5 MHz at the 3dB points), what does matter?

\$\endgroup\$
1
  • \$\begingroup\$ They are real insofar as real circuits also like to correlate signals with sine waves, but this is a good alternative perspective to consider anyway. \$\endgroup\$ Commented Jul 23, 2020 at 21:18
-2
\$\begingroup\$

Basically, a PWM signal is created using the fundamental harmonic and it's odd order harmonics. F_fundamental = 100kHz. F_3= 3*100kHz. F_5= 5*100kHz...

This happens because cosine is an even function. The sine function is odd and goes to zero for odd harmonics. This is why you don't see any amplitude at the odd numbers after the fundamental.

The amplitude decreases because n is the current number of harmonics. The greater n is, the smaller the coefficient of the integral for that term is.

K(1/(n*pi)) as n -> infinity, the term gets smaller and approaches 0.

The analysis is done here at the link below. The document explains how to do the integral. It defines the function f(t) as a piece wise defined function. fourier analysis

\$\endgroup\$
2
  • \$\begingroup\$ Sorry, this is simply incorrect. Any type of square wave or even a triangle wave is composed of a fundamental frequency and its odd harmonics only. The even harmonics only come into play when creating a sawtooth signal, or some other type of signal that does not have forwards-and-backwards symmetry. The fact that cosine is an "even" function is not relevant; the same holds whether it's cosine (even function) or sine (odd function). \$\endgroup\$
    – Mr. Snrub
    Commented Mar 4, 2019 at 23:16
  • \$\begingroup\$ You can edit your answer to correct the errors. Welcome to EE.SE. \$\endgroup\$
    – Transistor
    Commented Jul 23, 2020 at 21:12

Your Answer

By clicking “Post Your Answer”, you agree to our terms of service and acknowledge you have read our privacy policy.

Not the answer you're looking for? Browse other questions tagged or ask your own question.