0
\$\begingroup\$

I know how to plot the Fourier transform, but is there a more precise way to measure the total harmonic distortion?

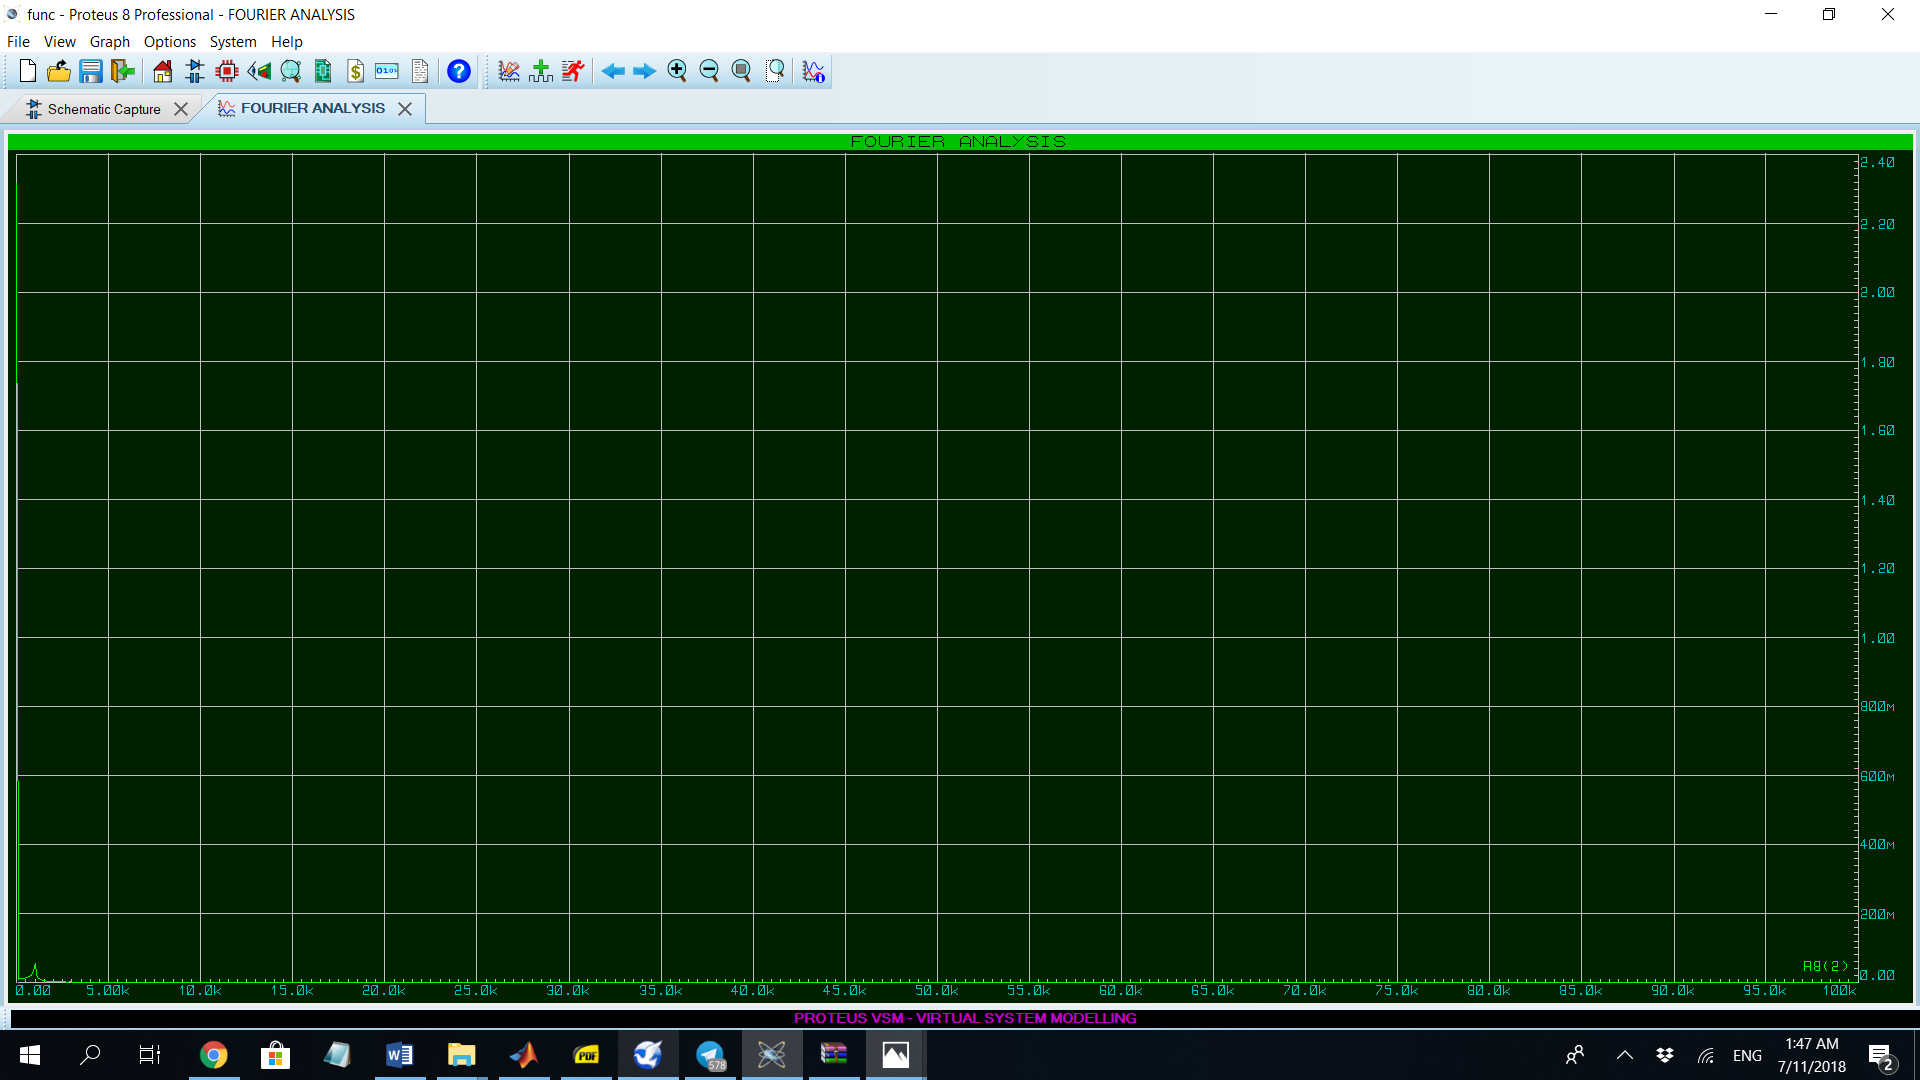
I have this graph:

fourier

As you see, there's only one distinguishable component at 1 kHz which is what I want. I need a THD less than 5% . Is the ThD zero here?

\$\endgroup\$
5
  • \$\begingroup\$ Well it certainly is, based on your plot, but your plot is rather useless. Try removing the mean of your input signal before computing the FFT. Either way, the calculation from your fixed data set is going to largely depend on the number of samples and on your windowing function. \$\endgroup\$ Commented Jul 10, 2018 at 21:42
  • \$\begingroup\$ @BlairFonville How do i remove the mean? \$\endgroup\$
    – Mah
    Commented Jul 10, 2018 at 21:53
  • \$\begingroup\$ Take the ratios of rms harmonics to fundamental \$\endgroup\$
    – D.A.S.
    Commented Jul 10, 2018 at 23:57
  • \$\begingroup\$ @TonyEErocketscientist The thing is I can only see one peak at 1 kHz. \$\endgroup\$
    – Mah
    Commented Jul 11, 2018 at 1:49
  • \$\begingroup\$ Yes I see better now. Can't you normalize it on a log scale? \$\endgroup\$
    – D.A.S.
    Commented Jul 11, 2018 at 2:03

1 Answer 1

-1
\$\begingroup\$

I ended up transferring the data to a DAT file. You can access that in the graph tab for that.

\$\endgroup\$

Your Answer

By clicking “Post Your Answer”, you agree to our terms of service and acknowledge you have read our privacy policy.

Not the answer you're looking for? Browse other questions tagged or ask your own question.