1
\$\begingroup\$

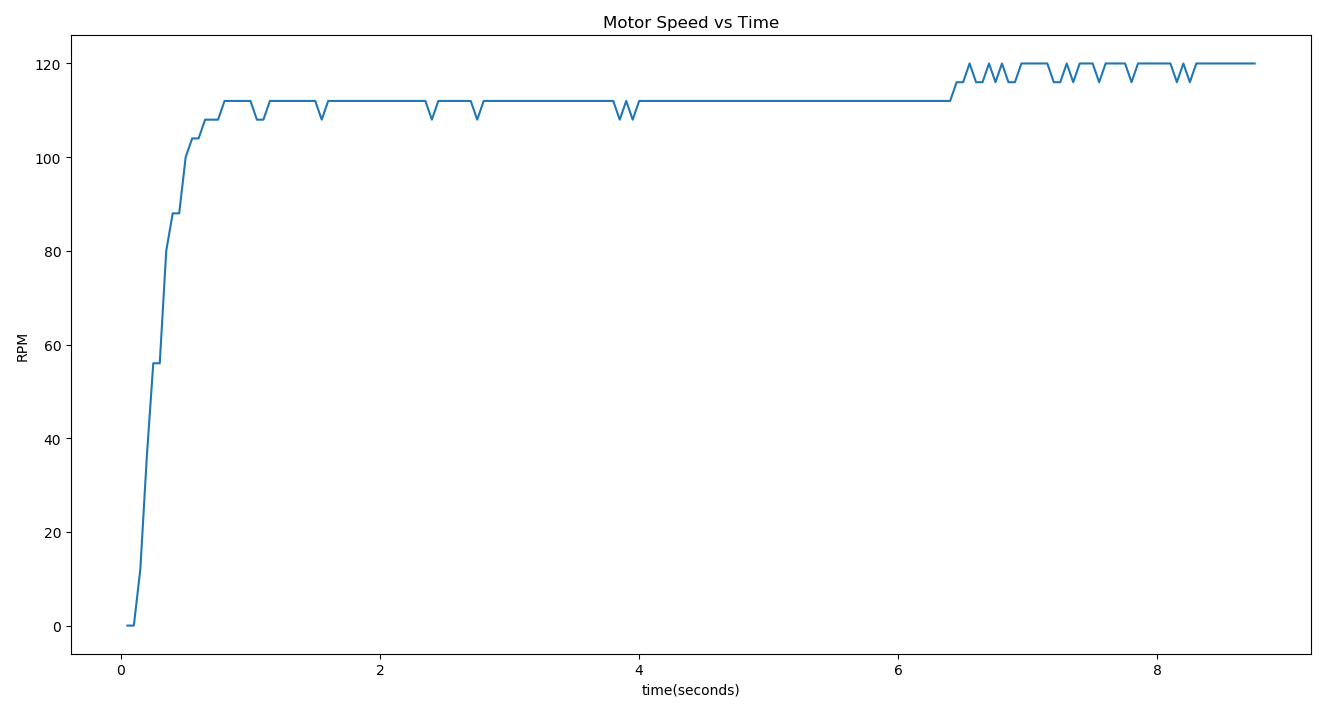
I have a pwm driven DC motor control system with magnetic encoder that measures the output shaft speed and outputs the RPM values every 50ms over serial comms to plot a graph of RPM vs Time. The system is stepped from 0 to 10% of the maximum possible duty cycle initially and then after a period of time stepped again from 10% of the maximum to 20% of the maximum. I would now like to determine the parameters of the system from this graph - mainly the time constant, gain and time delay.

\$\tau\$ is measured as 0.63 of the steady state value. So this is obtained by taking 0.63*112 = 70.56 and finding the corresponding time, roughly 400ms.

I'd like to know if I have the correct approach in obtaining the gain. I found this formula:

\$K = \frac{\Delta Y}{\Delta U}(t \to \infty)\$

Does this mean I can calculate the gain as the RPM difference between 10% and 20% duty cycle step divided by the difference between the duty cycle step. i.e

\$ K = \frac{120-112}{20-10} = 10.8\$ experimental response
edit:

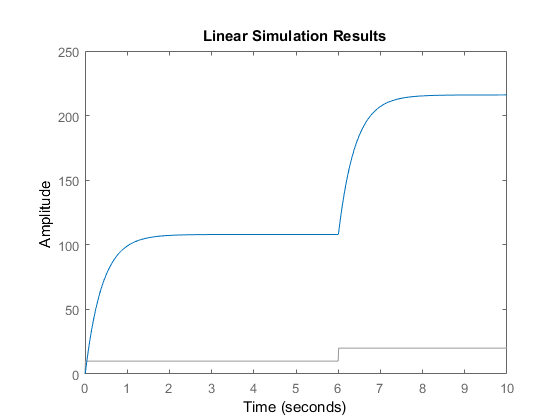
I plotted the theoretical response obtained from the experimental response. The step to 20% duty cycle does not seem to correspond to the experimental output.

k = 10.8;
tau = 0.4;

num = k;
den = [tau 1];

H =tf(num,den,'InputDelay',0.1)

t = 0:0.01:10;
u = 10*(t>0)+10*(t>6);

lsim(H,u,t)

Matlab plot

\$\endgroup\$
3
  • \$\begingroup\$ Where does the 220 RPM come from? The graph shows 120 RPM, making \$\Delta Y = 120-112\$. Still, the system as plotted exhibits quite a non-linear behavior over the 0% to 20% range: the gain is clearly different on each step, which should not happen in a linear system if the control increase in each step was of the same amplitude. You can only approximate a first order linear system if you limit the considered operational range, it definitely is not first order linear system from the entirety of 0% to 20%. \$\endgroup\$ Commented Sep 1, 2018 at 22:34
  • \$\begingroup\$ @VicenteCunha apologies, that was a typo. Thanks for your response. In plotting the theoretical transfer function I noticed that for a gain of 10.8 the 20% input should give an RPM closer to 200 than 120 so something must be wrong in the physical system itself. \$\endgroup\$
    – Blargian
    Commented Sep 2, 2018 at 8:28
  • \$\begingroup\$ Decrease your sampling time (increase sampling freq.) in order to produce a decent plot. \$\endgroup\$ Commented Sep 2, 2018 at 15:15

1 Answer 1

0
\$\begingroup\$

Yes. But for a system to have a single gain value requires a linear relationship between input and output. In that case, the gain is the difference in the output at steady state over the difference in the input, just as your formula describes. So the system gain, at least between 10% and 20% input, is 10.8 RPM per % duty.

\$\endgroup\$
2
  • \$\begingroup\$ I added a plot of the transfer function derived from the experimental data for 10% and 20% inputs. The 10% input produces the same RPM value as the experimental however the 20% input does not, it produces much more. I'm not sure I understand the discrepancy. \$\endgroup\$
    – Blargian
    Commented Sep 2, 2018 at 9:02
  • \$\begingroup\$ Yep, the real system has less than linear gain. All sorts of real world effects prevent a linear relationship, such as heating, friction, air resistance, magnetic losses, etc. In theory if you double the input you get double the output. In practice you get something less. \$\endgroup\$ Commented Sep 2, 2018 at 21:50

Your Answer

By clicking “Post Your Answer”, you agree to our terms of service and acknowledge you have read our privacy policy.

Not the answer you're looking for? Browse other questions tagged or ask your own question.