1
\$\begingroup\$

I'm trying to apply a filter to an audio signal in MATLAB and having some trouble processing it.

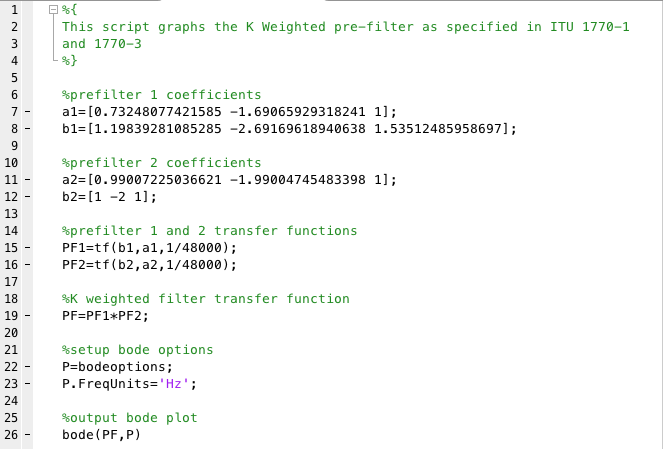
So far, I have a transfer function that describes a K-weighted filter, and I am able to create a bode plot that looks correct.

K-weighted filter Bode plot

Here is the script for that one: K-weighted filter script

I have another script that reads audio from a .wav file, plays it, and plots the waveform.

WAV file playback and plotting

That works properly too. Now I want to run that audio file through the K-weighted filter but I'm having trouble with that part.

I am able to use the "designfilt" and "filter" functions to create various filters and process the audio, but I can't get that to work with the transfer function I've created.

My transfer function PF is expressed in the z domain, but it doesn't show up as a proper digital filter in MATLAB.

Is there a way to create a digital filter from my PF transfer function or its coefficients directly?

I've tried using "filtfilt" and "lsim" to process the audio but I haven't had any luck yet.

I've also tried "output=filter(PF,audio)", which returns an error message saying there aren't enough input arguments, and "output=filter(b1,a1,audio)" which returns a matrix that says "NaN" repeatedly.

I'm sure there's something obvious I'm missing or some syntax errors, hopefully somebody here can point me in the right direction.

Thank you for your time.

\$\endgroup\$

1 Answer 1

0
\$\begingroup\$

You need to filter the data at some point. The filter function is a good one to use if you've already created a transfer function\filter, the filter TF is being applied to the data going into the filter in.

 dataout = filter(TF,datain);
\$\endgroup\$
6
  • \$\begingroup\$ Thank you for your quick response. After running my 2 scripts above, I tried typing "output = filter(PF,audio)" and I get an error saying there aren't enough input arguments. I've also tried using the coefficients directly: "output=filter(b1,a1,audio)" but that just gives me a matrix full of "NaN". When I plot it, it doesn't resemble the input signal. When I play it back, it sounds like a click/pop. \$\endgroup\$ Commented Sep 24, 2018 at 23:55
  • \$\begingroup\$ Try this form then dataout = filter(b,a,datain) \$\endgroup\$
    – Voltage Spike
    Commented Sep 25, 2018 at 0:01
  • \$\begingroup\$ yes that's what I mean, when I do that, it outputs a matrix that just says "NaN" repeatedly. When I play back that output with the "sound" function it sounds like a quick high pitched beep then a pop. When I plot the waveform it doesn't resemble the original at all. Could it be a problem that I'm reading a stereo file? \$\endgroup\$ Commented Sep 25, 2018 at 2:50
  • \$\begingroup\$ Check the input data for nan's with the y= isnan(data) function if there are any any nan's then check y to see if there are any true values or any(y==1) if there are any that are nans then you need to find them and replace them with zero or interpolated value. \$\endgroup\$
    – Voltage Spike
    Commented Sep 25, 2018 at 4:18
  • \$\begingroup\$ Cool, just tried that out and it returned all 0s. The input seems to be proper since it even plays back and plots normally (I'm using a 5 second piece of a song from a 48kHz 24bit WAV file). Thanks again for taking the time to help me through this, I appreciate it. This seems like a simple task, I must be missing something basic here. I just can't connect the dots between making a Bode plot and running a signal through the same transfer function. \$\endgroup\$ Commented Sep 25, 2018 at 4:47

Your Answer

By clicking “Post Your Answer”, you agree to our terms of service and acknowledge you have read our privacy policy.

Not the answer you're looking for? Browse other questions tagged or ask your own question.