1
\$\begingroup\$

Image 1

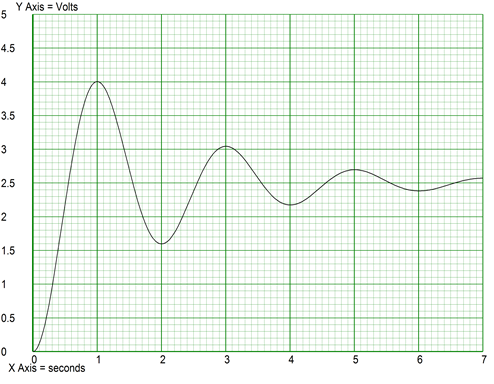
I have been given this step response graph and asked to determine the second order transfer function of the system. I completed the question, using a lot of help from this post and got the answers below:

  • steady state gain = 2.5
  • un-damped natural frequency = 3.18 rad/s
  • damping factor = 0.16

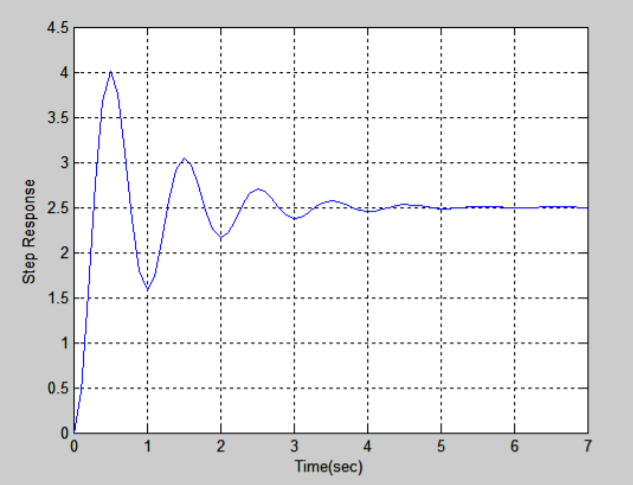
I then decided to use ServoCad to produce a graph of my transfer function, to compare against the original and check my answers. This is the graph below. The two graphs look very similar, but on my graph each oscillation appears to take double the time it should on the original graph.

I feel like this is a relatively simple mistake but I'm new to this so if anyone can point out where I've gone wrong I'd be grateful! Thanks!

enter image description here

\$\endgroup\$
3
  • \$\begingroup\$ Change the un-damped natural frequency = 3.18 rad/s to 6.36 rad/s. \$\endgroup\$
    – Andy aka
    Commented Mar 13, 2020 at 13:32
  • \$\begingroup\$ Hold on, you mean hertz not rads per sec. Maybe that was your mistake? \$\endgroup\$
    – Andy aka
    Commented Mar 13, 2020 at 13:37
  • 1
    \$\begingroup\$ @Andyaka I think you were right the first time. He used \$\pi\$ radians per cycle instead of \$2\pi\$. \$\endgroup\$ Commented Mar 13, 2020 at 13:53

1 Answer 1

1
\$\begingroup\$

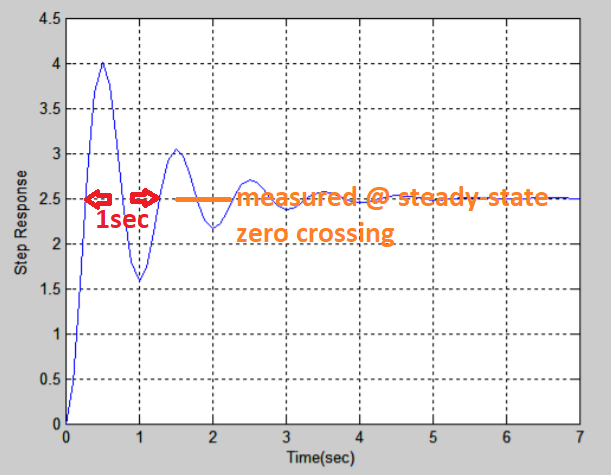
Here is a "quickie" way of capturing \$ \omega \$ by eye. Measure the time for one cycle. Use the zero-crossing points, translated by the steady-state (+2.5 in this case) to give you a time \$t\$.
This time measurement gives you frequency \$f= 1/t\$.
Then \$ \omega = 2\pi f\$:

You can use any of the many cycles along the steady state line to measure \$t\$; they should all have the same period. The first cycle will be the largest, where you can see its steady-state crossing points easiest. Cycles following the first have less amplitude, so that estimating where they cross steady-state becomes more difficult.
quickie eyeball period:
When waveforms are quickly damped, this method is difficult to apply...it is appropriate for slowly-damped waveforms. Some folks measure time from one peak to the next. This is less accurate with a quickly-damped waveform.

\$\endgroup\$
1
  • \$\begingroup\$ Thankyou! I think I was measuring t from one crossing point to the next, not to the next cycle, so I ended up with ω=π \$\endgroup\$
    – MendelumS
    Commented Mar 13, 2020 at 16:27

Your Answer

By clicking “Post Your Answer”, you agree to our terms of service and acknowledge you have read our privacy policy.

Not the answer you're looking for? Browse other questions tagged or ask your own question.