0
\$\begingroup\$

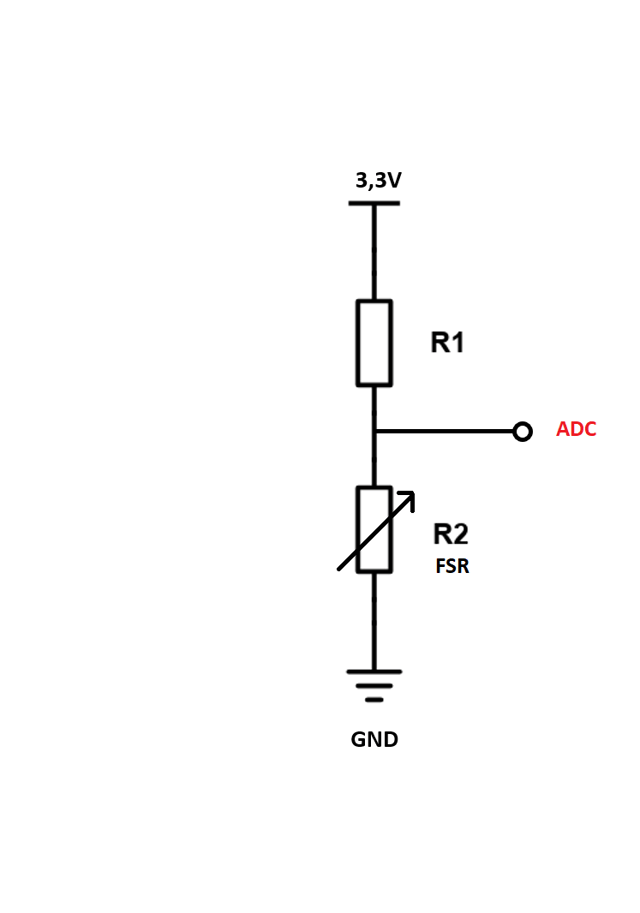
I have built a force sensor using an arduino and a self built force sensitive resistor (FSR.) The sensor system consists of a simple voltage divider, where the voltage across the FSR is measured by an ADC and the Arduino.

voltage divider

I'm trying to describe how good my sensor system is, and would like to do this by finding the uncertainty in measurement +/- newtons of the system.

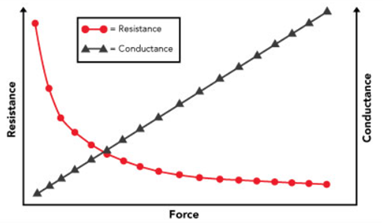
The FSR changes its resistance non-linearly to applied force (however the conductance changes linearly with force.)

fsr characteristics

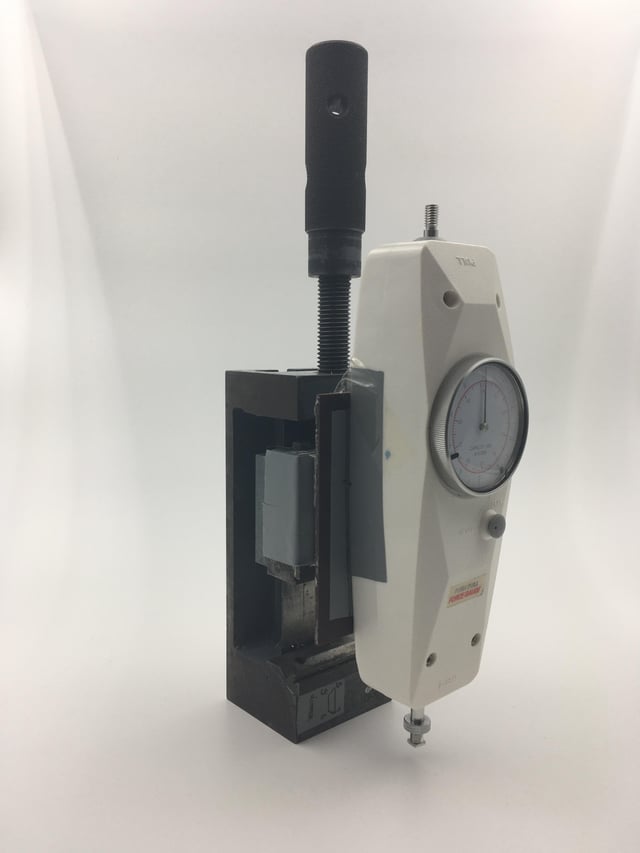
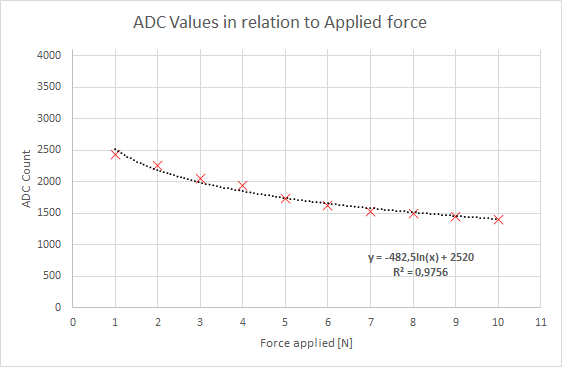
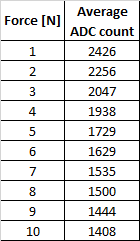
To calibrate the system, I used an analog force-push-pull gauge (range 0-10 N and resolution 0.05 N) with which I applied a force to my sensor from 1 - 10 N in 1 N increments. I measured the ADC counts at each force level and did 5 repeats and took the average, as shown in the table and the graph.

From the average, I plotted a logarithmic curve which has the function y=-482,5*ln(x)+2520 also shown in the graph below. This function can then be rearranged to solve for x which is Newtons = e^((2520.0/482.5)-(ADCvalue/482.5)).

Since the voltage ~ force (ADC~N) relationship is not linear, the sensitivity is not linear either. This means for low forces the sensor is sensitive, for high forces it is less sensitive. From my understanding the uncertainty in force measurement would be worse at higher forces because of the ADC quantization error.

In order to quantify the accuracy of the system would I have to perform a test measurement where I compare the newton values [N] which the sensor system shows according to the calibrated logarithmic function, compared to the force applied with the force push-pull-gauge?

How would I go about calculating the uncertainty of the system in +/- N?

force gauge

excel graph

excel table

\$\endgroup\$
2
  • \$\begingroup\$ They're not great devices, and you must load them in use in the same way mechanically as you load them in calibration. Start with "What functionality do I need for my task" instead of "how good can I get this. \$\endgroup\$ Commented Aug 29, 2021 at 13:43
  • \$\begingroup\$ " I measured the ADC counts at each force level and did 5 repeats and took the average," : 5 shots with arduino setup will not read good due to the noise. Let the arduino read continuously with a simple IIR filter. Oversampling and LPF eventually produce interpolation & decimation effect. \$\endgroup\$
    – jay
    Commented Aug 29, 2021 at 14:28

1 Answer 1

1
\$\begingroup\$

There are many other sources of error too, and could compute the 3 sigma variation with your algorithm , noise, drift and voltage reference error then add them up.

Design Improvements.

  • calibration is essential
  • You could also use 2 or 4 in a bridge method.
  • if you had a constant current source, you could measure conductance with a linear output
  • Using excel, if it is repeatable, you can compute higher order exponentials and correct errors in an Arduino. (When CV19 became global in March 2019, I used an 11th order polynomial with John Hopkins data to predict the curves 6 months out with high accuracy.)
  • You may have mechanical hysteresis problems, which depends on many factors.
  • read about tolerance-stackup calculations then decide if you want high confidence 6 sigma or std confidence 2 or 3 sigma for error probability
\$\endgroup\$
4
  • \$\begingroup\$ An 11th order model has little predictive value for most things. Fitting the data is not the same as having predictive value \$\endgroup\$ Commented Aug 29, 2021 at 14:04
  • \$\begingroup\$ @ScottSeidman Excel allows extending the curve in the future so yes, it may be useless in the stock market, but it was very enlightening for CV19 predictions and still is with multiple waves. When the past repeats even with noise and disturbances , it is predictive but with a larger tolerance \$\endgroup\$
    – D.A.S.
    Commented Aug 29, 2021 at 14:08
  • \$\begingroup\$ Even my early 5th order predictions were close enough i.sstatic.net/fHXYC.png \$\endgroup\$
    – D.A.S.
    Commented Aug 29, 2021 at 14:19
  • \$\begingroup\$ @TonyStewartEE75 I’ve seen that 2 sigma 95% confidence Interval is often used for uncertainty, which one is quoted as standard in industry by manufactures for example for the accuracy of a multi meter or thermometer? I understand this is tolerance the manufacturer ensures it will be within +/- % of V or degrees C but is this a sigma uncertainty quote? Also would this sigma uncertainty be calculated with the GUM method by adding in a certain way type A and B uncertainties? \$\endgroup\$ Commented Aug 29, 2021 at 20:10

Your Answer

By clicking “Post Your Answer”, you agree to our terms of service and acknowledge you have read our privacy policy.

Not the answer you're looking for? Browse other questions tagged or ask your own question.