2
\$\begingroup\$

EDIT: Op amp is a UA741CP

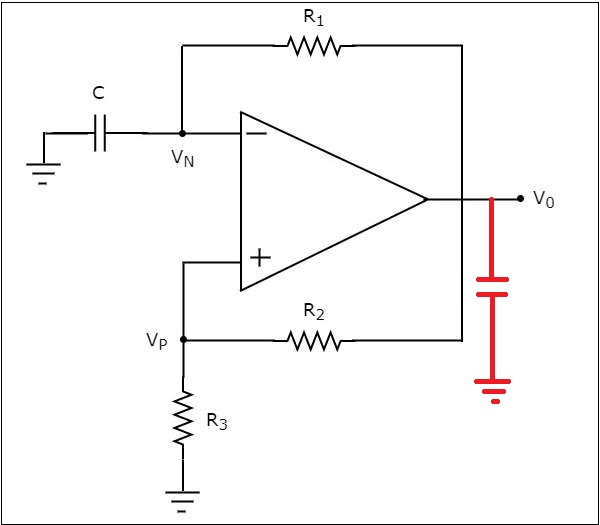
I built a simple square wave generator on a breadboard as shown in the picture below.

C = 1 μF

R1 = 1k

R2 = 10k

R3 = 10k

Supply voltages are +/- 12V

The circuit produces a 21 Vpp square wave at 410 Hz measured at the output.

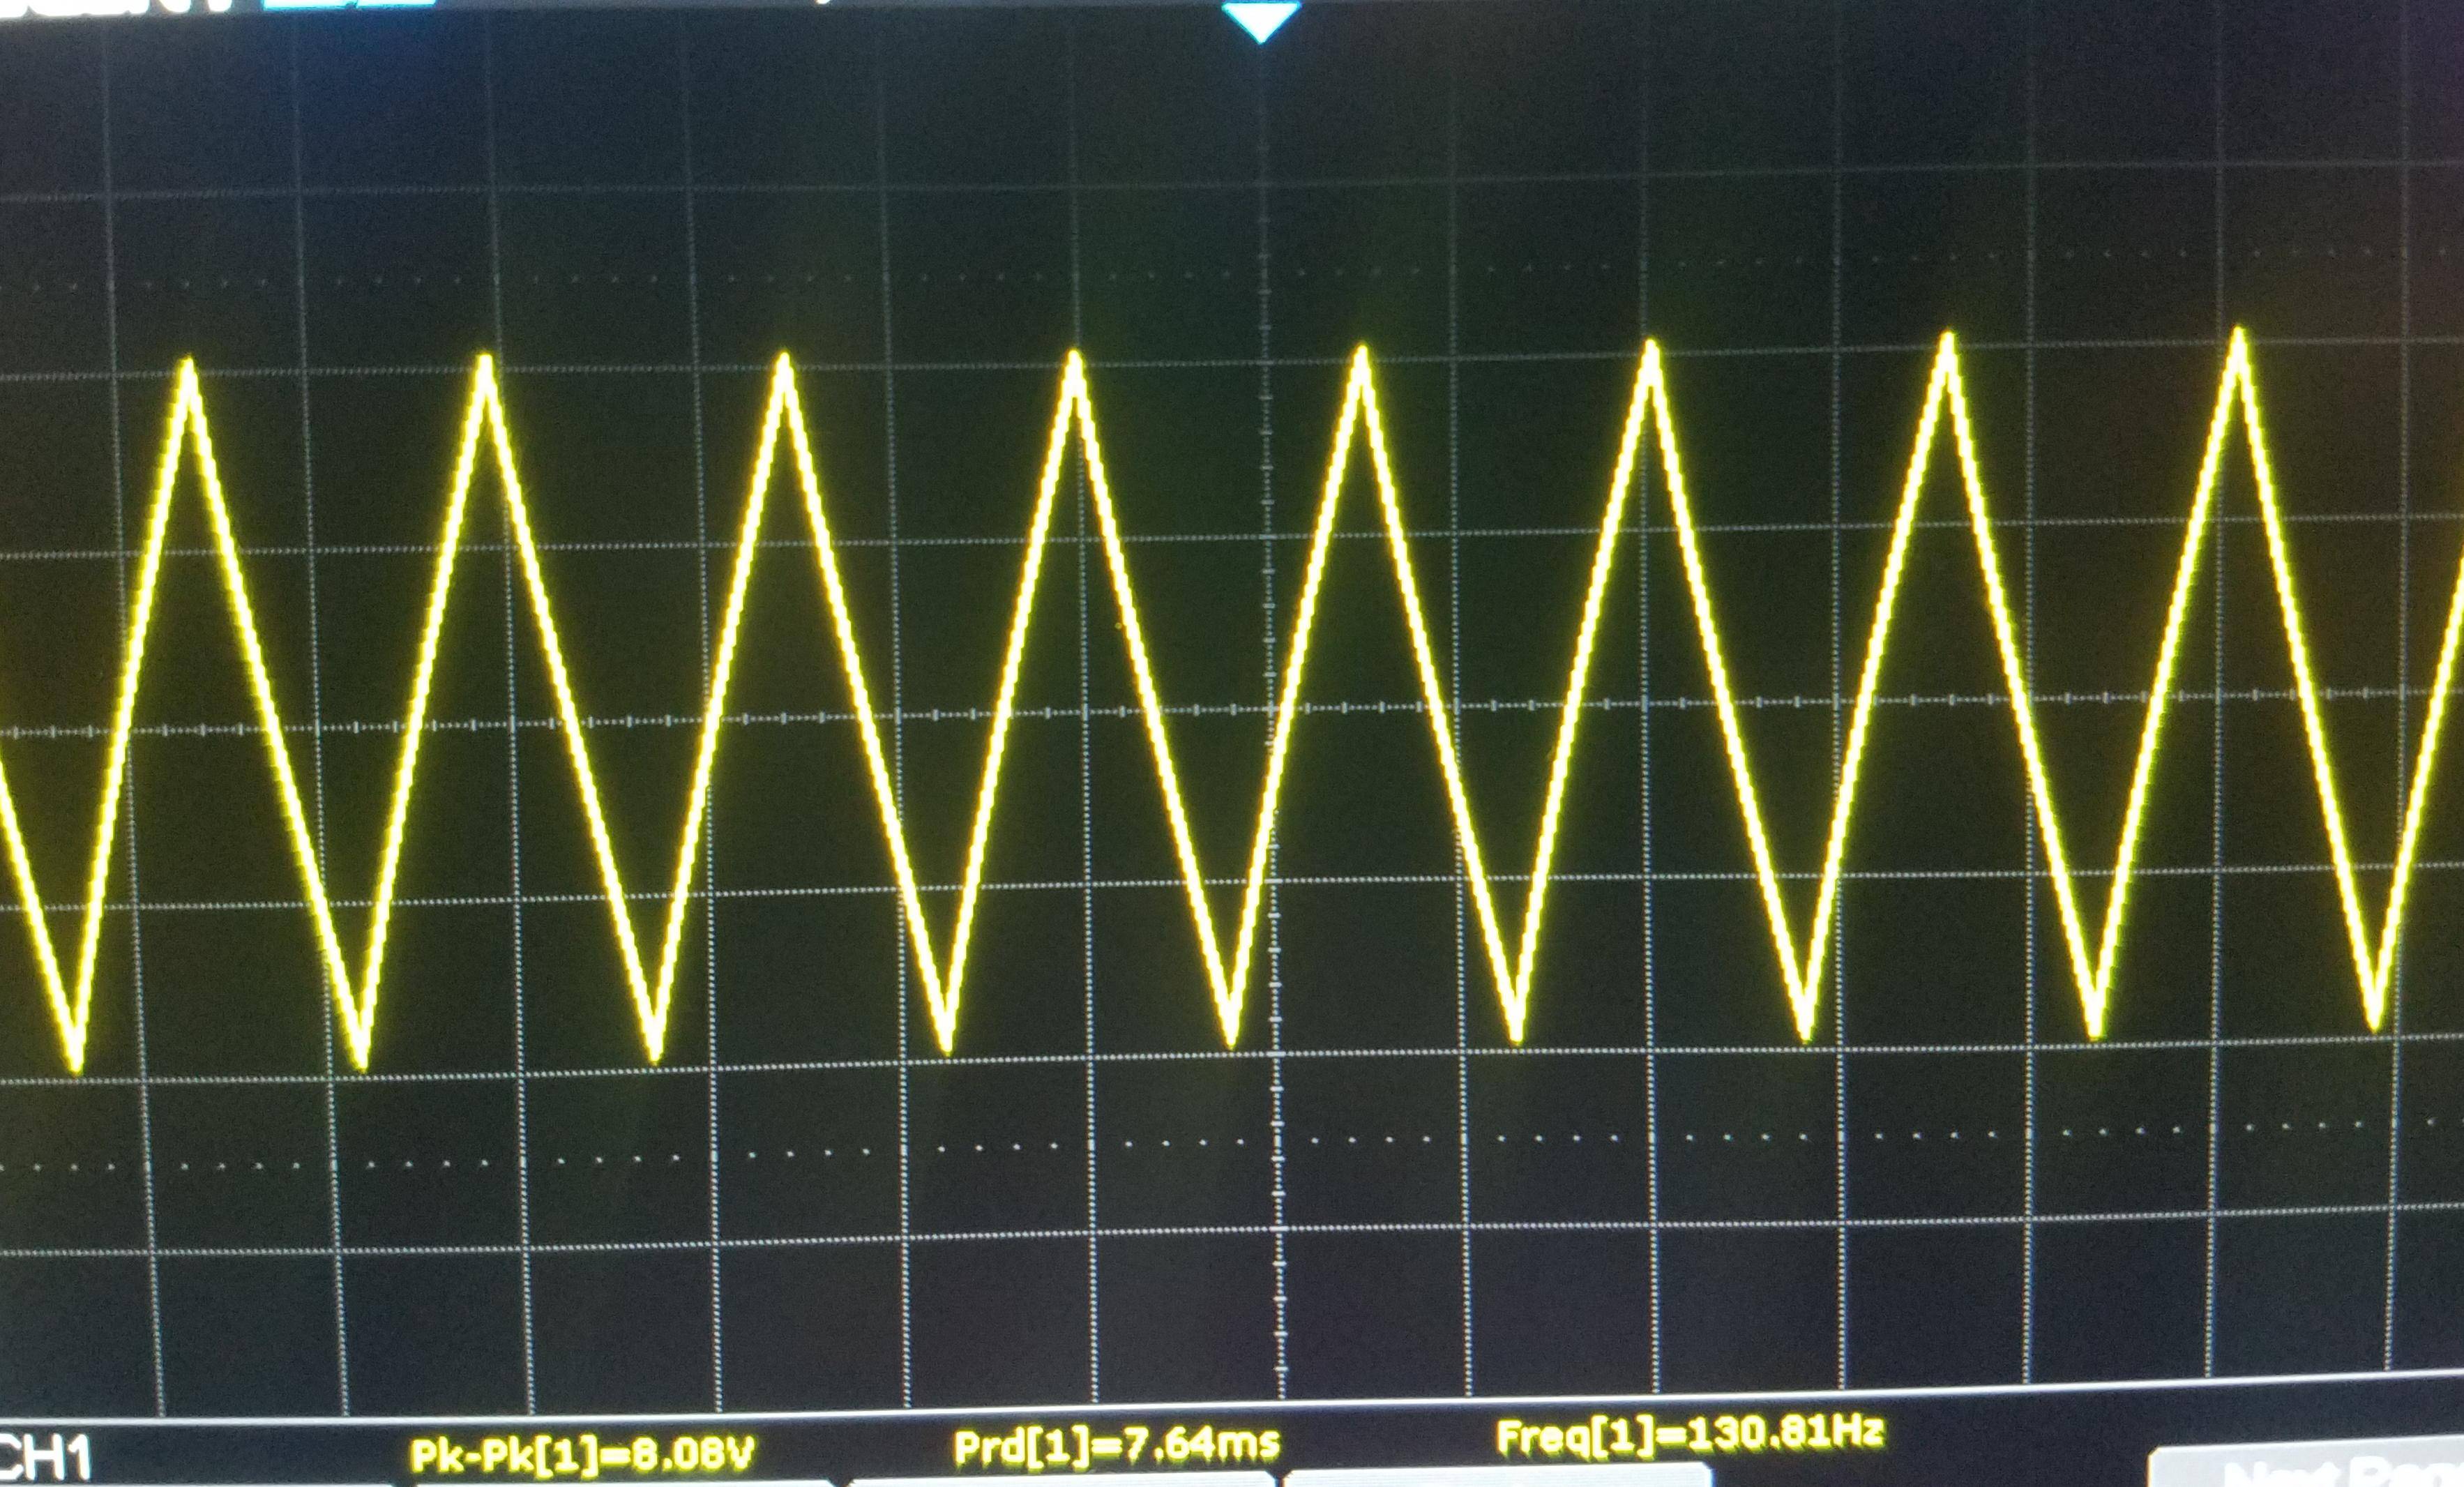
I was experimenting with the circuit and added the red-lined capacitor (10 μF) direct from the op amp output to ground. The result was a near perfect triangle wave measured at the output.

I expected to see some change to the slew rate of the output, but I cannot explain the observed waveform. Since the voltage of the output capacitor changes linearly, that implies that the current is constant, which is not what I would expect here.

How does this capacitor change the op amp behavior so significantly?

Circuit

Waveform

\$\endgroup\$
7
  • \$\begingroup\$ what is the max output current rating of the opamp you are using? Does that explain the dV/dt you are seeing into that C? \$\endgroup\$
    – user16324
    Commented May 12, 2022 at 16:06
  • 1
    \$\begingroup\$ The capacitor and the output impedance of the op amp form an integrator. What is the effect of integration on a square wave? \$\endgroup\$
    – GodJihyo
    Commented May 12, 2022 at 16:11
  • 3
    \$\begingroup\$ An awful big capacitor for a poor little op-amp to drive! \$\endgroup\$ Commented May 12, 2022 at 16:20
  • 3
    \$\begingroup\$ I guess you probably hit the op-amp's maximum output current, and it is now struggling to charge the capacitor. An ideal op-amp would create the same square wave with large current spikes to charge the capacitor, but your one that exists in the real world is not doing that. \$\endgroup\$ Commented May 12, 2022 at 16:29
  • \$\begingroup\$ C with R1 form a integrator. \$\endgroup\$
    – Jun Seo-He
    Commented May 12, 2022 at 17:47

3 Answers 3

5
\$\begingroup\$

Without knowing the part number of the opamp you are using it's impossible to give a detailed explanation of what you are seeing.

If we assume you're using some jellybean opamp, like the TL081 or the LM358 (or similar) the problem can be explained considering their open-loop output resistance \$R_0\$, which is around some hundreds ohm. The following explanation is made under that assumption. This doesn't mean there aren't additional factors at play, depending on the specific opamp.

If we assume an LM358 opamp, then \$R_O = 300 \Omega ~@~ 1MHz\$ at no load, according to the datasheet of TI (see page 7).

enter image description here

You are operating near DC (0Hz), so the output resistance could be well a bit higher, due to the absence of capacitive effects at the opamp output stage.

From your scope screenshot your signal has a frequency \$f_{out}\approx130Hz\$ hence a period \$T_{out}=1/F_{out}\approx7.7ms\$. Therefore the output ramp duration is half that, i.e. \$T_{ramp}\approx3.8ms\$. Keep all this in mind.

Now, when the output tries to charge the load capacitor \$C_{load}=10\mu F\$ through its internal resistance it does that with a time constant \$\tau = R_{out}\cdot C_{load} = 300 \Omega \cdot 10\mu F \approx 3ms\$.

This means that the output ramp is just \$ 1.3 \cdot \tau \$, so what you are seeing is just the initial part of the exponential charge cycle of the load capacitor. This is also justified by your snapshot, where you can see that the rising ramp is not perfectly linear, but it slightly bulges upwards, whereas the falling ramp bulges downwards.

To verify this, try and reduce the load cap by a factor of two, and you should see a bigger fraction of the charge/discharge cycle, which will resemble a "shark fin". If you reduce the load cap by a factor of 10, you should see a more or less square wave with smoothed edges.

The explanation above doesn't take into consideration other non-linear effects that could kick in when the output current is near or above the rated maximum (the output stage usually has some current-limiting circuitry). These effects will have the net result that the "equivalent" output resistance seen by the load cap will be much higher (the output will behave more or less like a current source/sink) and this will linearize the output ramp even more (a cap charged at constant current will produce a linearly increasing voltage at its terminals).

EDIT (after OP provided opamp part number)

Now, consider the datasheet of the opamp (TI). At page 10 you find the internal schematic, reproduced below with emphasis by me:
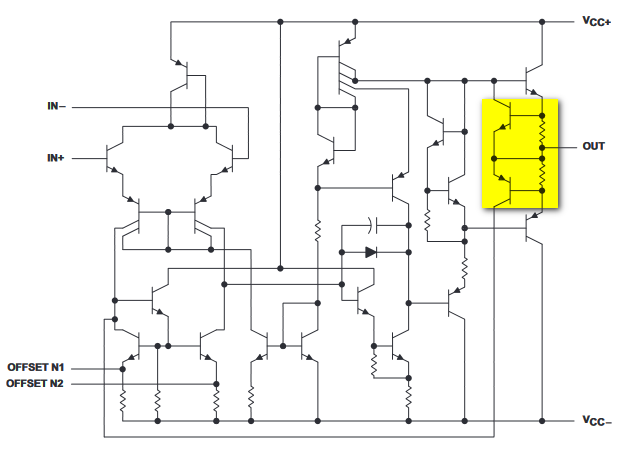
enter image description here

Those two BJTs with those two resistances are the output current limiting circuit. To protect the output transistors, that circuit activates when the load draws too much current and limits dissipation in the output stage.

When the opamp output is in current limiting regime it acts as a (non-ideal) current source/sink, so that's what you are seeing in the scope image.

The frequency is no longer set by C1-R1 alone, since the output doesn't change abruptly from positive to negative saturation, and therefore the switching threshold set by R2-R3 changes (linearly) with time since it is half the output voltage.

I simulated your circuit with LTspice, using the UA741 SPICE model provided by TI. Here's the schematic:
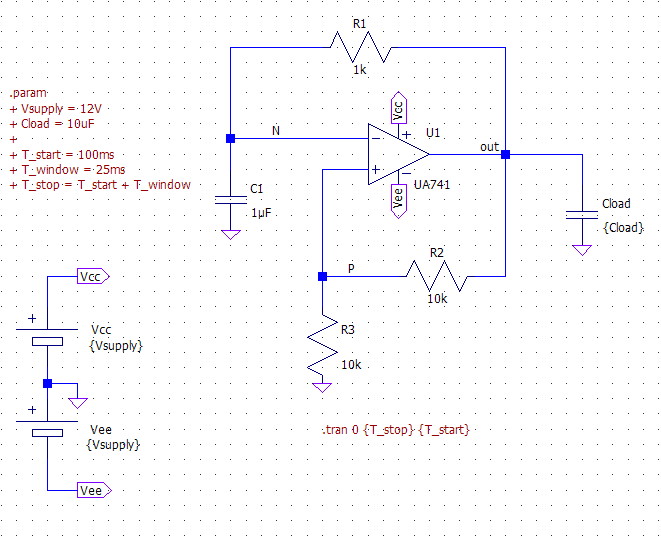
enter image description here

and here are the plots of the output and the input signals:
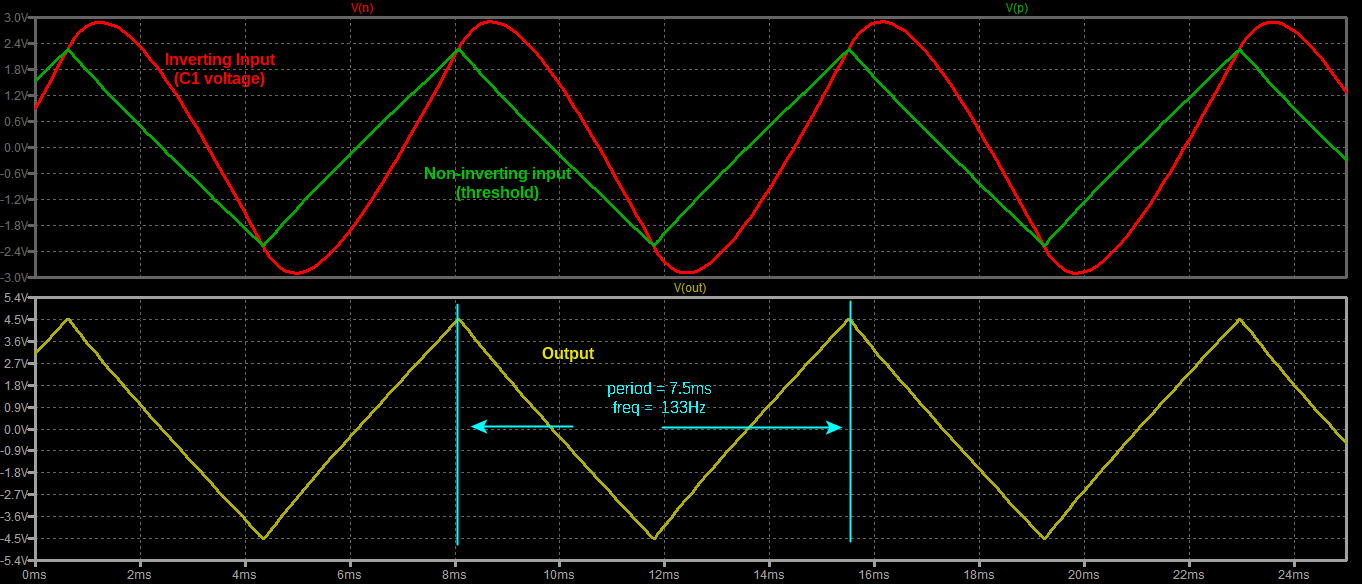
enter image description here

As you can see the simulation matches your measured circuit behavior quite well.

\$\endgroup\$
1
\$\begingroup\$

First, I do hope you've noticed that the frequency has changed significantly.

Now, let's take two separate paths. First, how fast is the output changing? That's easy, it's about 8 volts in 4 msec. The rate of change is 2000 volts/second.

Next, if your 10 uF cap were being charged at, let's say, 20 mA (a decent first value for this sort of op amp), what would the rate of change be? That is i/C, or (20 x 10^-3/10^-5) and that equals 2 x 10^3, or 2000 volts per second.

That is not a coincidence.

So it's pretty clear that the op amp is TRYING to produce a square wave, it's just that it can't charge the capacitor fast enough to do it.

EDIT - And, because the time constant of R1/C was small enough to produce 410 Hz without the capacitor, it follows the output with almost no effective lag. So the effect of the cap is dominant in setting the frequency. If you were to increase C by a factor of 10, or even better, 100, you'd see an output which looks a lot more like a square wave - when you adjust the timebase of your display to give the same number of cycles. END EDIT

\$\endgroup\$
0
\$\begingroup\$

Using the loose limits for current limiting , you have an integrating current limited Relaxation Oscillator.

A better triangle generator will have a constant voltage across R at all times as it toggles with some positive feedback. I posted recently a simulation short link that does this.

This was just a Relaxation Oscillator with negative DC feedback for self bias but +ve feedback determines the hysteresis and the input swing range for dV/dt=Ic/C . But as Vc is charging up Vr/R=Ic is reducing so the current is not quite constant and will show a slight exponential curvature.

Adding the big output cap made it current limit on the square wave to turn into an alternating current source but lacking precision from tolerances and also lacking much output amplitude.

The Op Amp has low output impedance that rises with frequency due the internal compensation integrator, towards the internal series R or current limiting source impedance such that adding C to output adds another LPF pole thus reducing the slew rate , trying to be an output square wave voltage. Since dV/dt= Imax/C this big C adds no obvious benefit. Vin- was already a large triangle wave. Thus you have two integrators now and the linearity improves , the smaller in amplitude it gets.

There is still a much better way.

\$\endgroup\$

Your Answer

By clicking “Post Your Answer”, you agree to our terms of service and acknowledge you have read our privacy policy.

Not the answer you're looking for? Browse other questions tagged or ask your own question.