I'm trying to visualize the charge discharge curve of a capacitor with Arduino. This is my curcuit:

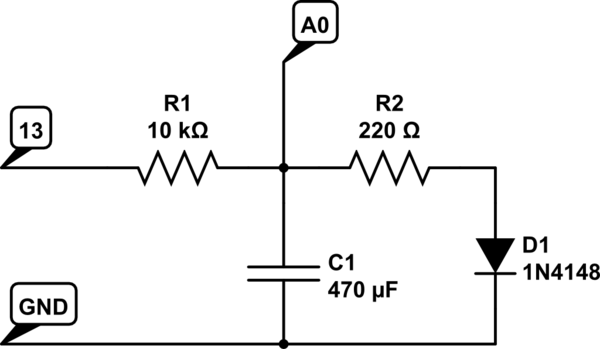
simulate this circuit – Schematic created using CircuitLab
13 is pin 13 of the Arduino and A0 is the analog pin 0 that I use to read voltages at that point.
What I do is to set 13 to HIGH/LOW with time spans of around 4.7 seconds, which is the loading time for that capacitor with the 10k resistor.
I expect that the charging should be slow, so I should get, when 13 is set to HIGH, a growing curve that doesn't really make it to the asymptotic value. When 13 is set to LOW, the discharging is going to be done though the 220 resistor, so it should be faster, and while voltage at that point decreases to 0, I should see the curve get down really fast.
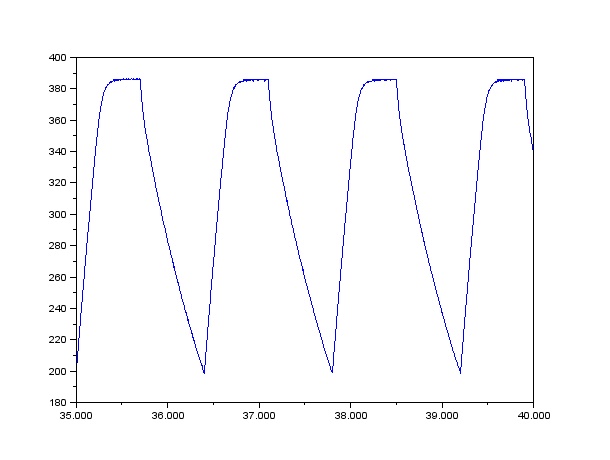
Am I right or wrong in something (clearly wrong). The thing is that after getting the data through Serial and plotting it, I get just the opposite of what I expected:

So... what is going on?
