2
\$\begingroup\$

I am using C compiler and PIC controllers. I've been wondering about measuring the performance of the f/w code that we write. I have two versions of structures for the same code:

First one: using while

main()
  {..
   .. 
  initialization;

  while(check for conditions)
  {...
  ..
  .
  }

}

Second one: Using sequential states, or State machines.

main()
    {..
     .. 
    initialization;

    switch(state n)
    {...
    ..
    .
     }

    }

Well, my doubt is that whether I do either way, how will I measure which one is the best way to go forward? I realized that the polling feature of the first method is often used in simple embedded systems. While the state machines of the second one is mostly used for single processor embedded systems.

  • How can I measure which firmware is best?
  • How can I monitor the statistics and related performance data?
  • Do compiler produces any valuable data to be checked, or is it debuggers that I must entrust?
  • What are the common tools available to measure the performance of a firmware?
  • Is it possible with a Debugger like Pickit3 /ICD3? I got a pickkit3 at hand.

I will be extremely grateful if you share your knowledge about dealing with firmwares and clarifying my doubt.

\$\endgroup\$
5
  • \$\begingroup\$ Why not compile both and compare the disassembly? \$\endgroup\$
    – Matt Young
    Commented Jan 28, 2014 at 3:02
  • \$\begingroup\$ what details do i get from disassembly.I have never done it before \$\endgroup\$
    – Rookie91
    Commented Jan 28, 2014 at 3:03
  • \$\begingroup\$ You get the exact instructions that will be converted to machine code. In other words, the exact instructions that the core will will execute. \$\endgroup\$
    – Matt Young
    Commented Jan 28, 2014 at 3:05
  • \$\begingroup\$ And if you're using the free version of the XC8 compiler, it really won't matter because it will insert 3 or 4 branch instructions between each actual instruction. \$\endgroup\$
    – Matt Young
    Commented Jan 28, 2014 at 3:18
  • \$\begingroup\$ Defined "performance". I'm not being coy. You need to know what you are measuring before you can compare anything. \$\endgroup\$
    – user65586
    Commented Mar 29, 2016 at 1:05

5 Answers 5

6
\$\begingroup\$

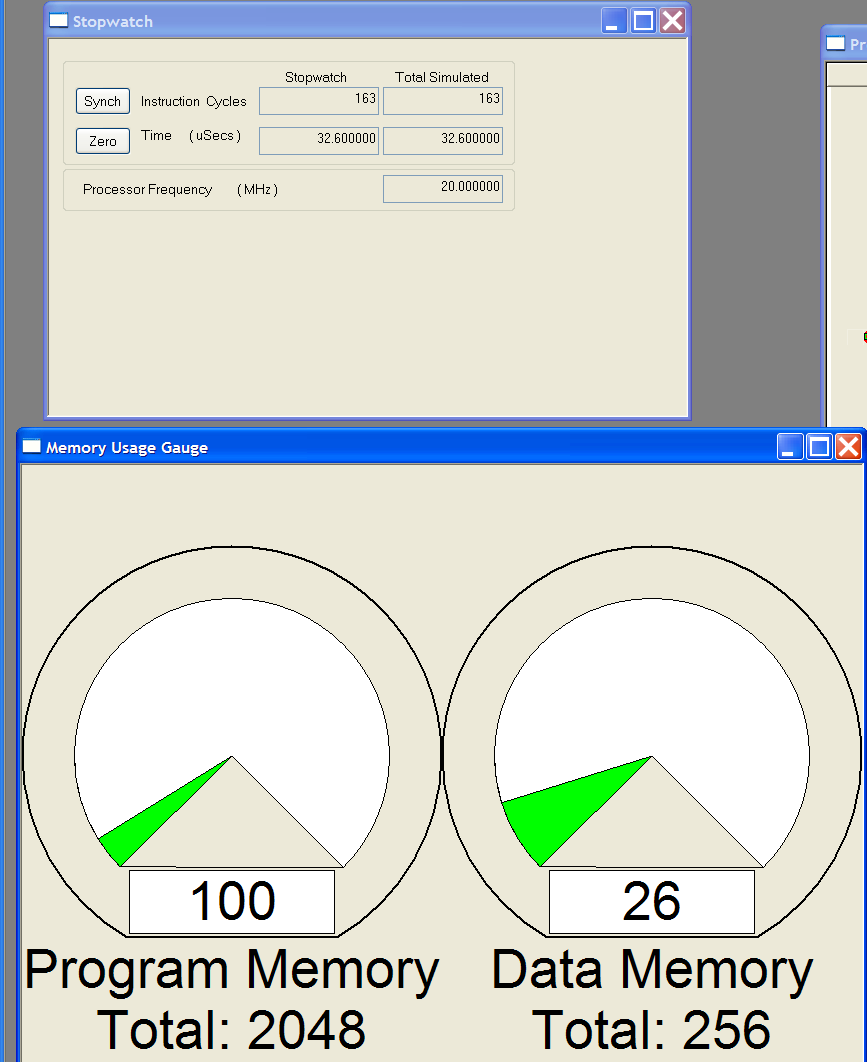
If you use MPLAB, simply simulate with the "Stopwatch" function.

You can insert breakpoints and profile the code, accurate to the cycle. Very useful.

Of course you can look at the Memory Usage Gauge and see the code size when it's compiled.

It's also useful to look at the disassembled code, as others have suggested, especially in tight ISRs.

enter image description here

\$\endgroup\$
4
\$\begingroup\$

In terms of speed performance, I would strongly recommend to use the undisputed King of firmware benchmarking: the oscilloscope. You really can't be professional firmware developer without having access to one.

Performance-measuring fluff of your IDE or linker may be useful, but in the end you will still have to test and verify your timing in the real world, outside the IDE.

\$\endgroup\$
2
\$\begingroup\$

What is your measure of "performance" - polling rate? latency something else? If performance means polls per second, ie., you simply want the fastest loop possible, you can toggle an output bit and measure it's frequency with a scope or a handheld meters that can measure frequency.

\$\endgroup\$
1
  • \$\begingroup\$ I do this often; it's a very good technique \$\endgroup\$ Commented Jan 29, 2014 at 5:48
2
\$\begingroup\$

what details do i get from disassembly.I have never done it before

Do compiler produces any valuable data to be checked, or is it debuggers that I must entrust?

You'll need to get familiar with the machine language of your particular PIC if you want to start dabbling in optimization. Quite often, you'll see some code which looks innocent enough in C, but in terms of how many machine language instructions it takes, well...

The canonical example of the power of the PIC24 XC16 compiler:

_LATA0 ^= 1;            // toggle a bit

becomes this in machine language:

mov.b _LATA,W0
and.b W0,#1,W0
btg W0,#0
and.b W0,#1,W0
and.b W0,#1,W2
mov.w #0x02c4,W1
mov.b [W1],W1
mov.b #0xfe,W0
and.b W1,W0,W0
ior.b W0,W2,W0
mov.b W0,0x02c4

even though there is a bit-toggle machine language instruction btg. Why does this happen? C compilers often don't take advantage of special hardware in their target micros unless the compiler authors specifically target that hardware.

Your first pass at optimization (before measuring) should be a quick browse of the disassembly. See which C instructions are translated into the highest number of machine language instructions. Try different approaches to the problem and see which yield the fewest instructions. You'll quickly build up some experience with what code patterns to avoid and which to stick with.

How can I measure which firmware is best?

What are the common tools available to measure the performance of a firmware?

Is it possible with a Debugger like Pickit3 /ICD3? I got a pickkit3 at hand.

As others have said, the easiest ways are generally:

  • by physically toggling some I/O lines and measuring with a scope
  • by using the simulator and stopwatch tool available in MPLAB

You 'wrap' your target code with the bit-toggles (or breakpoints) and measure how long execution takes. Then, if you find a performance issue, go back to your disassembly, figure out which code is taking a long time and refactor it, then retest.

\$\endgroup\$
1
  • \$\begingroup\$ +1 for toggle an IO line & measure with scope. That method even led me to discover that the macro for pin-toggling (PORTn ^= PINnBIT) was a lot slower than writing PINnBIT to the PINnSET/PINnCLEAR registers! \$\endgroup\$
    – John U
    Commented Jan 29, 2014 at 17:34
2
\$\begingroup\$

I like to look in terms of can my system do what it needs to do in the time that it has. I bit-toggle in critical places, and make sure I have plenty of headroom to accomplish a task. In other places, I make liberal use of flags, to make sure that things are in shape for a routine when called, and once in the routine, I'll exit with an error code if its not.

In embedded systems, great is most definitely the enemy of good where optimization is concerned. The best firmware is the firmware that A) works, and B) does what you need it to do, while C) remaining understandable and somewhat supportable. Optimizing beyond that may be a misdirection of a precious resource.

This is certainly overstating the situation, perhaps "hyperbolic" is a good term for it. In Chapter 8 (Doing More With Less) of Elicia White's great O'Reilly book "Making Embedded Systems", she says:

Ultimately, optimization is an economics problem. You start out with a portfolio of assets associated with your system .... Your most liquid asset is development time, so think of that as money. Once you invest (or allocate) (sic) these assets to parts of the system, you lose the opportunity to use them in other systems....

As you consider different optimization strategies, consider as well the high opportunity cost that comes with investing your assets. Buying futures is almost always cheaper than waiting until the last minute and realizing you are seriously in debt with no easy way to recover.

Thus, making sure you start with enough system to do the job is the biggest part of the battle, and if you do that well enough, you won't need to squeeze your system for performance.

\$\endgroup\$
0

Your Answer

By clicking “Post Your Answer”, you agree to our terms of service and acknowledge you have read our privacy policy.

Not the answer you're looking for? Browse other questions tagged or ask your own question.