2
\$\begingroup\$

I am working on a project at school where we need sonar input to control a little vehicle. Pretty simple stuff, usually. However, we're having a bear of a time getting the sonar to work. My faculty adviser has helped us get a little closer to the goal but we're still up a creek and running out of time. The module is a Prowave SRM400. We wired it up to an Arduino with a transistor which will pull the MCU pin low for 500 microseconds (verified on o-scope) and we have also been able to verify that the out-pulse does get sent to the transducer. For a while we were getting some weird sawtooth looking data back with a curved front edge and a straight dropoff on the "right" side of the scope. The adviser then started to play with the potentiometers on the board and now it seems to not work at all. The datasheets are not super helpful about what the output is supposed to look like or how to interpret the output into useful data. There is one waveform supplied on the data sheet which is perfect digital square waves, and we definitely never saw anything like that. Does anyone have experience with this particular board? It's not a new device, I think it came out in 2003 or something, but I'm not able to find any help on it so far. How am I supposed to interpret the output coming from this board?

I might also mention this does not count as "helping a student do his homework." The class is about project management and the actual project is not so important... except ours is supposed to be used by grad students next year so it really needs to actually work.

SRM400 datasheet (note: the PDF has timing information on the waveform section, the HTML does not) http://www.prowave.com.tw/english/products/sr/srm400.htm The chip on the SRM400 is a PW0268, found here: http://www.prowave.com.tw/english/products/sr/sric/sric.htm What we saw point "A" coming from the MCU and point "C" between the control module and the transducer match the data sheet. This is the scope of the output to the MCU.
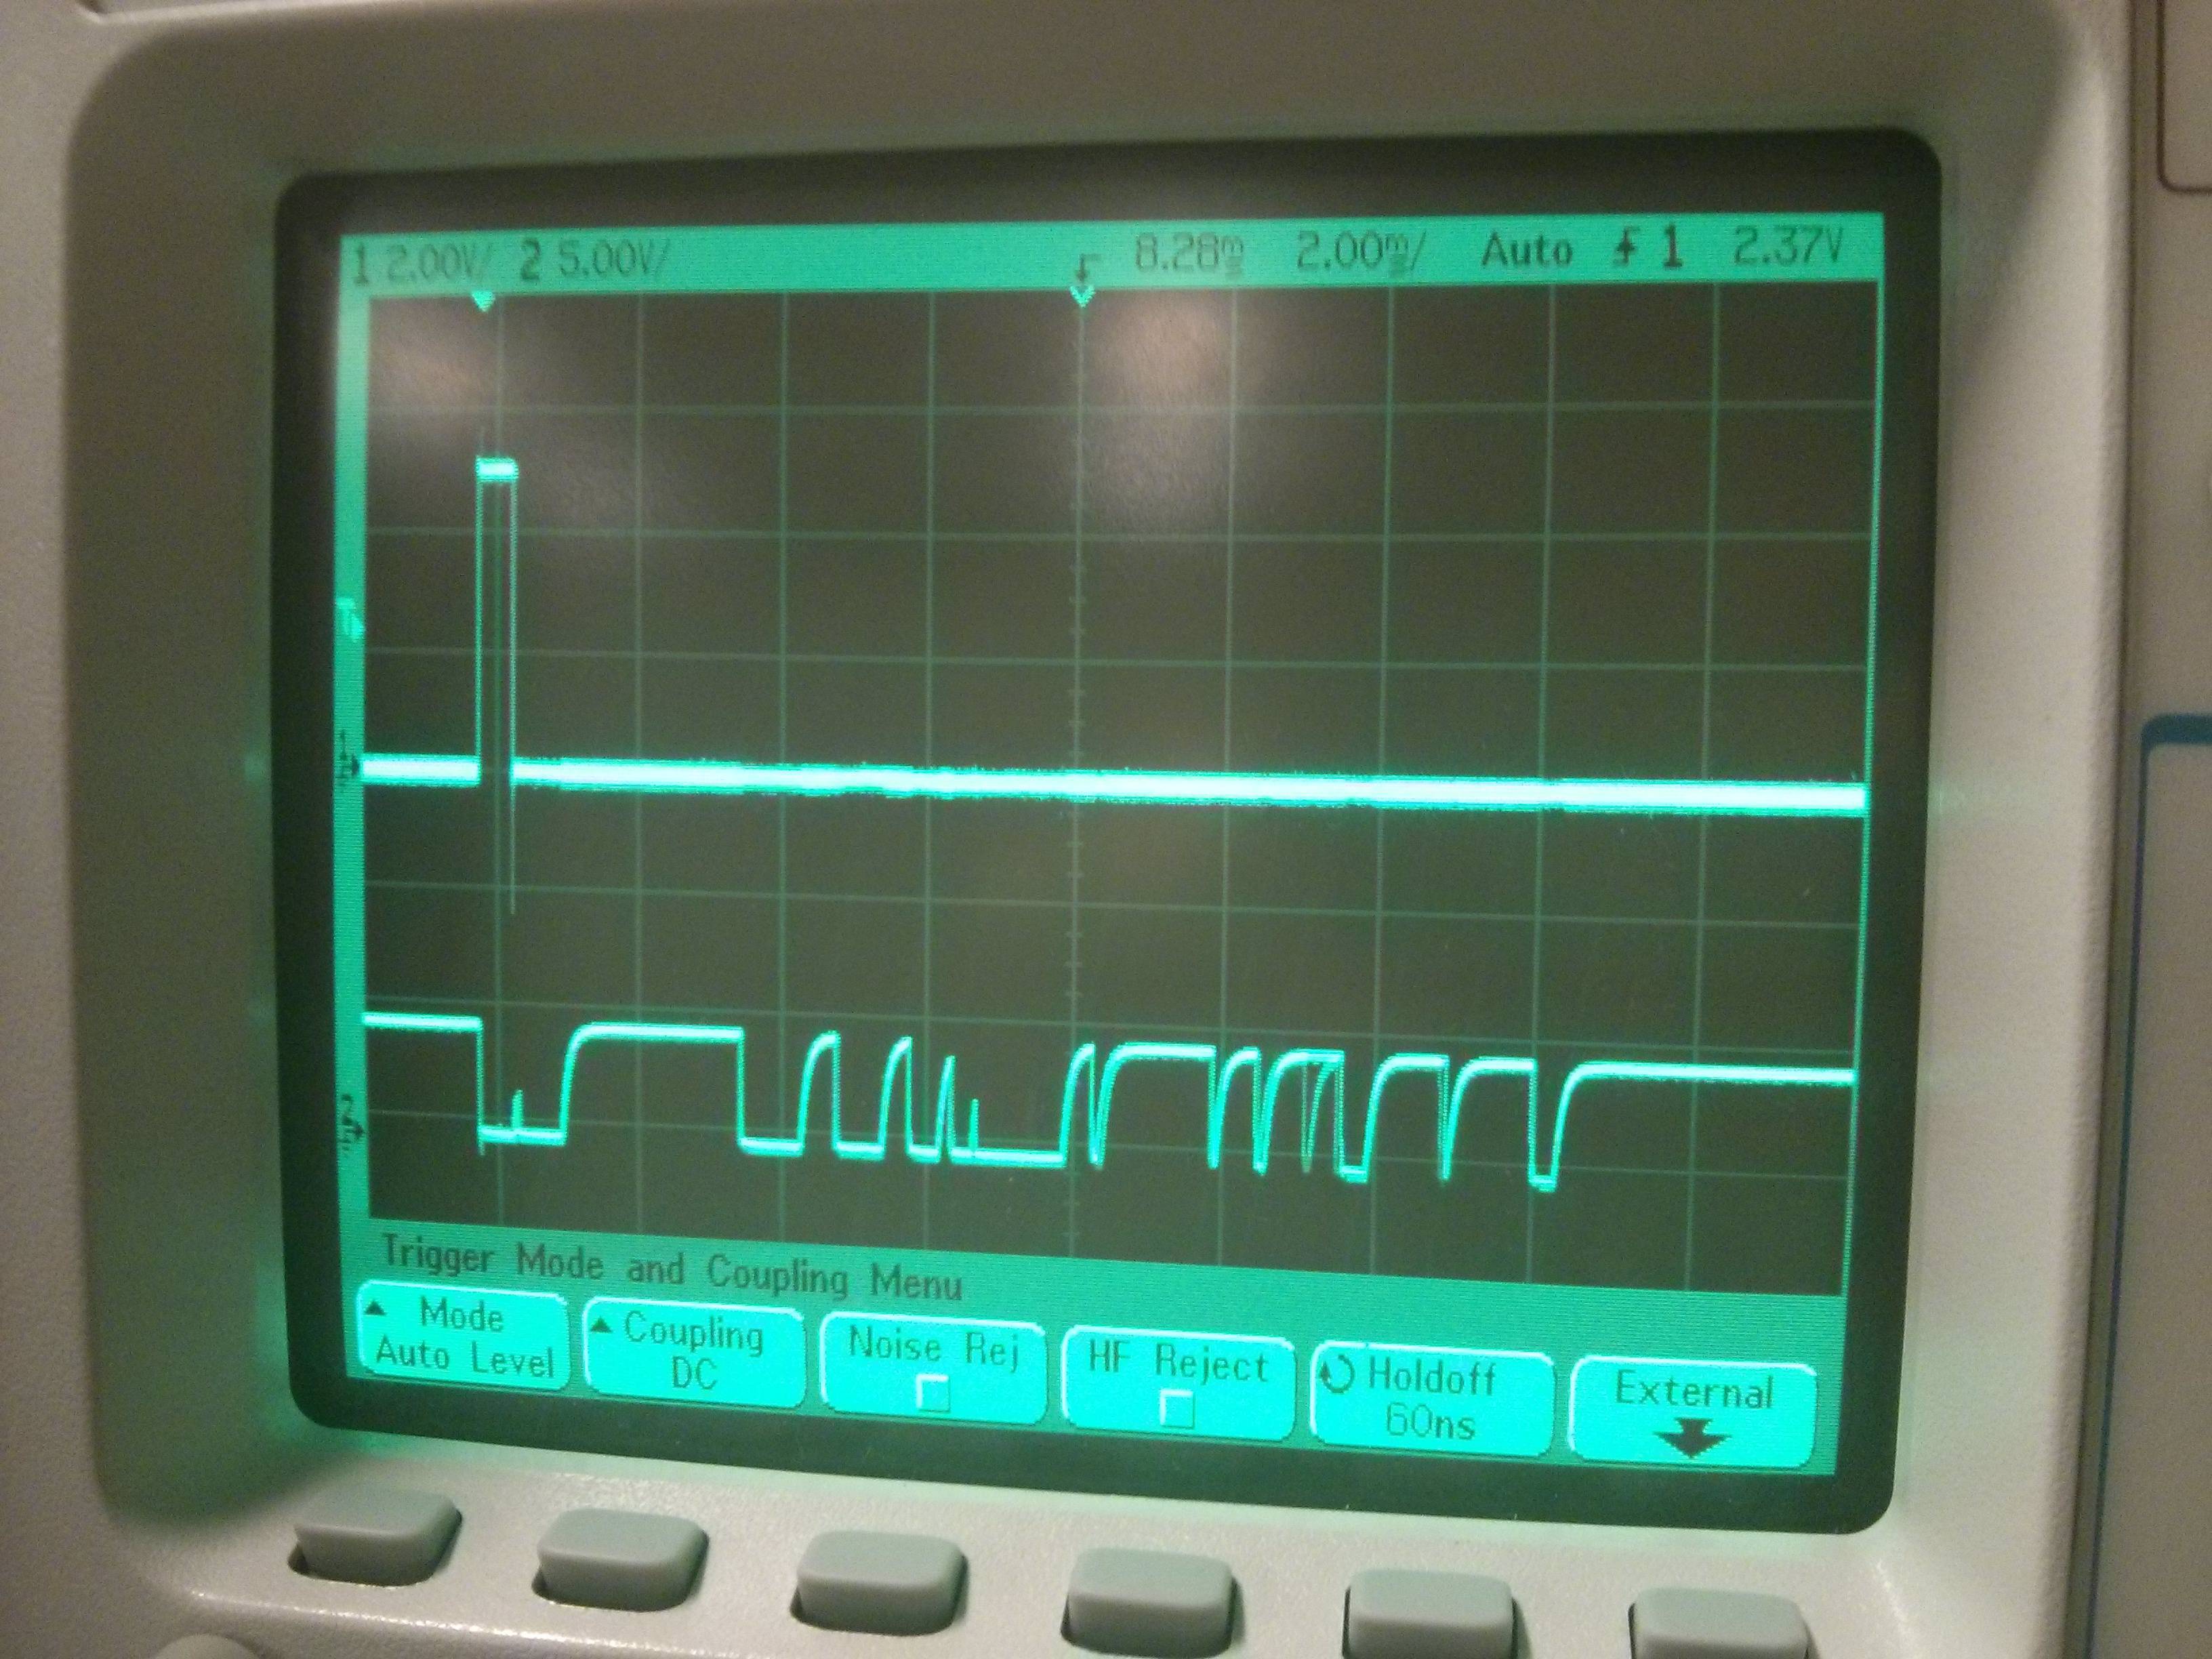
scope trace

\$\endgroup\$
6
  • \$\begingroup\$ Way too hand-wavey, show some scope captures and datasheets... \$\endgroup\$
    – Matt Young
    Commented Apr 15, 2014 at 17:11
  • \$\begingroup\$ Links added, I don't have any scope caps at the moment. \$\endgroup\$ Commented Apr 15, 2014 at 20:42
  • \$\begingroup\$ Instead of telling us (the dumb engineer) that this is a project management course, prove it by supplying timely information to your extended project team (us) so that the job can be done properly and on schedule. \$\endgroup\$
    – Andy aka
    Commented Apr 15, 2014 at 20:47
  • \$\begingroup\$ Doing my best, sir. O-scope from the bi-directional pin is up. Top trace is my output from the Arduino, nothing special. Bottom trace is the supposed output data. \$\endgroup\$ Commented Apr 15, 2014 at 22:09
  • \$\begingroup\$ Bottom has slow rise time from excessive cable capacitance with internal 5k pullup to 5V? It should be better . Each negative pulse on bottom is an echo of variable strength. Reduce load capacitance and compute leading (-) edge Tx to Rx for each pulse. Stretched negative pulses in middle are from excess ramp gain or very large reflectors \$\endgroup\$
    – user38637
    Commented Apr 16, 2014 at 3:19

2 Answers 2

1
\$\begingroup\$

Ok, let's remind ourselves how ultrasonic sensors typically work:

  1. Send out a pulse
  2. Wait for echo

Looking at the datasheet, after your initial pull low, the output goes high, then goes low whenever it detects echos. The examples given in the datasheet are for perfect (maybe even simulated) conditions.

So, what I see from your scope looks correct! After your initial pull low, the sensor sees an immediate echo (from itself) which it is designed to attenuate (ignore) - that's that tiny blip. Then the output goes high (waiting for an echo). Then it starts getting echos - apparently a lot of them.

So, what you need to do is pull it low, wait until the signal goes high, then start timing how long it takes to go low again (first echo). If you care about other reflections and multipath, you may try to analyze the remaining.

But dude, it's working fine!

\$\endgroup\$
0
\$\begingroup\$

Edit Looks like it works fine except for excess cable capacitance for 5k pullup. You might try twisted pair or shorter cable or add another 10k or 5k worse case for pullup to 5V echoes to all including the last one using negative edges indicate time of arrival of echoes. Use the velocity of sound in air for distance and width of negative pulse to mean size of object. Calibrate using stepped gap with a rigid block of known size for time interval and compare with computed delay results. Record sensitivity vs off axis at same radius to map beam pattern.

Endedit

Critical to all R&D is comparing results to specifications.

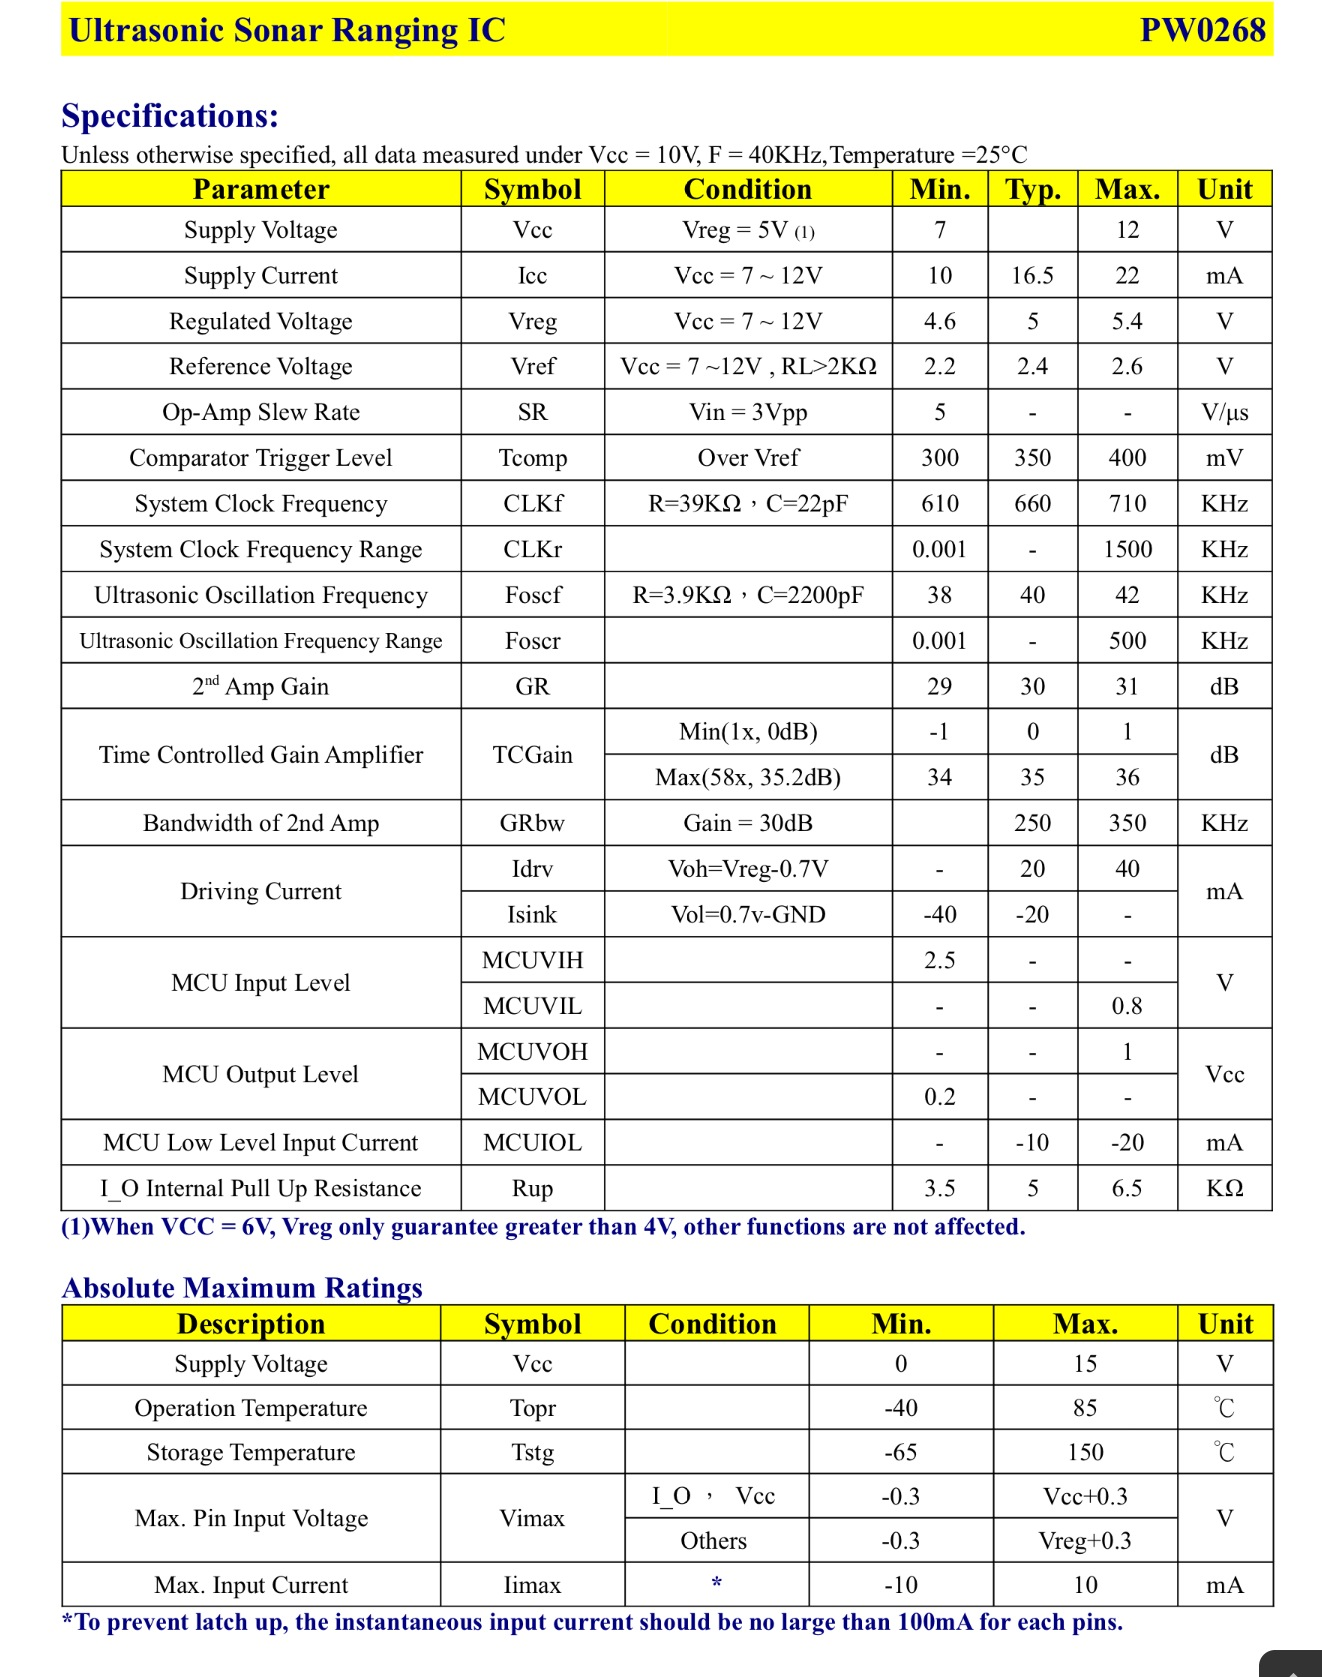
If you can manage to verify the table of every spec, starting from voltage , current, etc .. All the way down in a checklist. Then draw a thumbnail scope reading of each pin using short gnd leads on 1 page and then compare with spec...

Be wary that the chip uses a ramped voltage controlled gain to compensate for attenuation versus time delay due to inverse squared loss. You can verify he gain by "back driving" from another speaker + generator at a very low level to determine the threshold of gain without having to rig echoes at different distances.

Then, you should be able to pinpoint the issue or at least ask a better question!!

Read the Specs may require experience, but start with the analog inputs and outputs which get amplified filtered and detected into pulse shapes which can then be sliced into logic levels with the output transistor Vbe threshold. Draw the waveforms as thumbnails around the diagram from the data sheet

1: http://www.prowave.com.tw/pdf/sonaric.pdf, then compare with test results. record Vdc otherwise.

Professionals do this in their sleep. You have to start on paper.

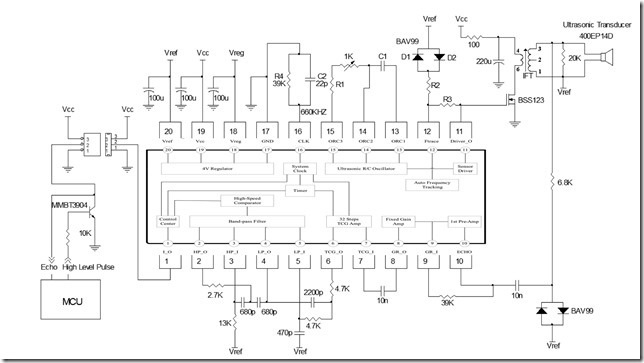
Here is a start for you, where I cut and paste the inside to the outside circuit. Someone can add arrows for direction the signals take here, which seems to be clockwise in his case.

enter image description here

enter image description here

\$\endgroup\$
2
  • \$\begingroup\$ Did you look at the data sheet? The specs are ... nearly nonexistent. Even if I were able to verify the amplifier gains, I'm an undergrad computer engineer (not EE); I don't know what that would signify. Perhaps the better question is: what does the output from this module actually mean? It says .05V-.9V digital echo signals. On the data sheet, they look digital. On my scope, they don't look digital. Even if they are digital and high for x micro-seconds is a 1 and low is a 0, there's no reference about how to turn the 1 and 0 into a meaningful value. \$\endgroup\$ Commented Apr 15, 2014 at 22:07
  • \$\begingroup\$ Rup in pin1 is 5K pullup to V+ so when it says 0.9*Vcc , that means 90% which is well above 50% nominal threshold for CMOS uC. ECHO thus shows the pulse for Tx & Rx ( receiver) at good logic levels, unless you have a faulty situation. You then use Time Interval measurements from Tx to Rx for distance and duration for strength of the echo. There is only one Pot. Shown, but many gain settings fixed parts can be increased. Gnd noise must be low, so use short probe grounds. \$\endgroup\$
    – user38637
    Commented Apr 16, 2014 at 3:03

Your Answer

By clicking “Post Your Answer”, you agree to our terms of service and acknowledge you have read our privacy policy.

Not the answer you're looking for? Browse other questions tagged or ask your own question.