0
\$\begingroup\$

The signal to noise ratio for a voltage, current, or power is easy to understand, but how do I calculate the SNR when the signal is not a physical property, but instead an abstract quantity?

I'll try and be clearer: I'm doing a theoretical project, and I have created a computer program that measures the solid angles that a simulated point subtends a number of simulated detectors. It then calculates the position of the point using these solid angles. I want to simulate what would happen if the detectors measure the solid angles with a slight inaccuracy. To do this I have added random numbers (between 0 and 0.01) to all of the simulated detector readings. I have called this noise, but I'm not sure if that is the correct term.

The detector readings can normally give a reading between 0 and 2pi, where 0 is when the point lies on the plane of the detector, but outside its perimeter, and 2pi is when the point lies on the plane of the detector, and in the center of detector perimeter. (They are 3D angles). This can be seen in this picture.

I want to express this noise as a signal to noise ratio. Can I just do:

$$0.01/2pi = 0.00159\%$$

Where 0.01 is the maximum size of deviation from the true value, and 2pi is the maximum size of the true value.


Here's another way to ask this question.

In my program the noise is simulated as:

$$Y=net(X+N)$$

Where \$Y\$ is the Position, \$net\$ is the function that maps \$X\$ onto \$Y\$, and \$N\$ is the noise.

I want to modify this function so instead of including \$N\$, it instead includes the Signal-To-Noise ratio. This is so I can do a sweep of the SNR to see how much noise my function \$net\$ can tolerate. How can I do this?

\$\endgroup\$
5
  • \$\begingroup\$ What is the distribution of your random number? \$\endgroup\$ Commented Jun 2, 2014 at 15:57
  • \$\begingroup\$ the random number is uniformly distributed. I should point out that the measured angles are not though. The angles can theoretically be between 0 and 2pi, but when a point is placed in there vicinity the angles are usually very small, around 0.1 steradians. \$\endgroup\$
    – Blue7
    Commented Jun 2, 2014 at 16:01
  • \$\begingroup\$ Can you maybe add a drawing showing what is meant by your measurement. For example, I'm not clear why an angle of \$2\pi\$ is not the same as an angle of 0 as it would be in normal use of radian angles? As for an analogy with SNR, first remember that SNR is usually a ratio of power or energy, not of signal magnitude. Second, it might help to "un-bias" your measurement by taking angle from -\$\pi\$ to \$\pi\$ and the error from -0.005 to +0.005. \$\endgroup\$
    – The Photon
    Commented Jun 2, 2014 at 16:13
  • \$\begingroup\$ @ThePhoton see this question for a drawing of the measurement: math.stackexchange.com/questions/805320/… . The detectors (circular disks) all receive a solid angle which noise is added to, and is then passed through a function which gives the position of the point. The measurement is a solid angle (3D angle). With this diagram it is easier to see when you get the max and min angles. \$\endgroup\$
    – Blue7
    Commented Jun 2, 2014 at 16:26
  • \$\begingroup\$ OK, that helps a bit. Could you edit your question to talk about solid angle when you want to talk about solid angle? The words angle and solid angle do not mean the same thing. \$\endgroup\$
    – The Photon
    Commented Jun 2, 2014 at 16:59

3 Answers 3

2
\$\begingroup\$

When talking about abstract quantities, we generally stop talking about "noise" and instead start talking about probability distribution functions (PDFs) and confidence levels.

You might be able to say, for example, that the answer (position) is correct to within 0.1 meters 95% of the time. You need to establish what your correctness criteria are for your application, and analyze how the PDF of the raw data gets transformed into the PDF of the result.

For a more detailed description, do some research into how the results are described for GPS receivers.

\$\endgroup\$
5
  • \$\begingroup\$ I thought this might be the case. I was a bit unsure about the word noise. I'm not sure about using PDFs or confidence levels either though. With no noise, my function is correct to within 100mm when averaged over 2000 examples. When the 0 to 0.01 "simulated misreading" is added to the input, the function is then correct to within 130mm. With 0 to 0.02, it is correct to within 150mm etc. I want to say: The function will provide a reasonably accurate result if the __________ is below _____. Where the blanks are the "simulated misreading". \$\endgroup\$
    – Blue7
    Commented Jun 2, 2014 at 16:53
  • \$\begingroup\$ It sounds like your baseline 100mm error is the result of quantization, either in the raw data or somewhere in the calculation. Your uniformly distributed random offset is a simplified model for all other sensor errors. You can draw a graph of average error (in the result) as a function of the magnitude of the random offset. Then, pick a point on that graph that represents whatever you mean by "reasonably accurate". Then you can say that the algorithm performs well if the "raw measurement error" is less than XXXX. \$\endgroup\$
    – Dave Tweed
    Commented Jun 2, 2014 at 17:11
  • \$\begingroup\$ In addition, in order to provide a more meaningful statement to your audience, you might want to analyze what the actual sources of measurement error might be if your system were ever to be actually built, and analyze their contributions to the PDF of the sensor readings, replacing the simple uniform-distribution model. But that might be beyond the scope of your project. \$\endgroup\$
    – Dave Tweed
    Commented Jun 2, 2014 at 17:20
  • \$\begingroup\$ If the system where ever to be built, the measurement will be the count rate, and the source of the noise is background radiation. I'll be honest with you, the fact that I have used solid angles instead of count rate has confused me from day one of this project. Its something that I was told to do by my supervisor, and I need to ask him soon why. I think the idea is that this is a theoretical project, and by proving that I can calculate the position from the solid angle shows that it is theoretically possible to calculate the position from the count rate given by any detector. \$\endgroup\$
    – Blue7
    Commented Jun 2, 2014 at 17:27
  • \$\begingroup\$ Oh I forgot to mention, the point I am localizing is radioactive. And the detectors (if the real thing was built) would be scintillation detectors. \$\endgroup\$
    – Blue7
    Commented Jun 2, 2014 at 17:30
1
\$\begingroup\$

To do this I have added random numbers (between 0 and 0.01) to all of the simulated detector readings.

This means your measurement is always greater than the actual value you want to measure. This is adding a bias to your measurements. You might want to consider using numbers in the range (-0.005, 0.005) instead of (0, 0.01). This would reduce systematic error, but what really matters is whether it accurately models the noise you are likely to see in the real system.

I have called this noise, but I'm not sure if that is the correct term.

I think it is fair to call this a measurement noise.

I want to express this noise as a signal to noise ratio.

You probably want to use values analogous to energy or power rather than amplitude when expressing the SNR. In statistical terms you'd want to compare the variance of the error with the variance of the signal.

The variance of a uniform random variable on (a, b) is

\$ \frac{1}{12}(b-a)^2\$.

You'd want to compare this with the variance of the ideal value,

\$\int_0^{2\pi} (\Omega - \bar\Omega)^2 p(\Omega) \mathrm{d}\Omega\$

where \$\Omega\$ is the solid angle and \$p(\Omega)\$ is the probability of that solid angle occurring.

I want to modify this function so instead of including N, it instead includes the Signal-To-Noise ratio.

I'm not clear why you'd want to do that, or how expressing the error in terms of SNR would help make the problem simpler.

\$\endgroup\$
0
\$\begingroup\$

The subject is closely related to statistics and probability. There are two types of errors when performing measurements:

SYSTEMATIC: Deviation of the mean from the true value. Related to accuracy. Can not be reduced by taking the average of a large number of results, but only for calibration (compensation). For example, your sensor can provide some offset when reporting its value.

RANDOM: Or statistical. Deviation of the measured values from the average. Dispersion (variance / standard deviation). Related to precision (which is divided into repeatability / reproducibility). Unpredictable. Can not be reduced through calibration.

This is the point of Signal-To_Noise ratio. It's a very simplified scenario when you say:

To do this I have added random numbers (between 0 and 0.01) to all of the simulated detector readings. I have called this noise, but I'm not sure if that is the correct term.

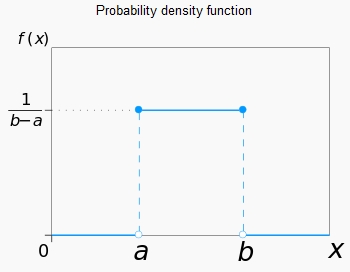
In fact you would have to know (or estimate) the statistical properties of this noise. Some useful questions: The average is zero? What is your distribution involved (or better, its probability density function)? Uniform, Gaussian, ... For example, a random signal uniformly distributed between limits a and b, as shown below, has mean \$\mu=(a+b)/2\$ and variance \$\sigma^2=\frac{1}{12}(b-a)^2\$

UD

In general, SNR is be given by:

$$SNR (dB) = 20\log(\frac{S_{RMS}}{N_{RMS}})$$

where:

$$N_{RMS}^2 = \mu^2 + \sigma^2$$

If \$\mu=0\$, it becomes more simpler.

\$\endgroup\$

Not the answer you're looking for? Browse other questions tagged or ask your own question.