87
\$\begingroup\$

If I have sampled a signal using proper sampling methods (Nyquist, filtering, etc) how do I relate the length of my FFT to the resulting frequency resolution I can obtain?

Like if I have a 2,000 Hz and 1,999 Hz sine wave, how would I determine the length of FFT needed to accurately tell the difference between those two waves?

\$\endgroup\$

8 Answers 8

105
\$\begingroup\$

The frequency resolution is dependent on the relationship between the FFT length and the sampling rate of the input signal.

If we collect 8192 samples for the FFT then we will have:

$$\frac{8192\ \text{samples}}{2} = 4096\ \,\text{FFT bins}$$

If our sampling rate is 10 kHz, then the Nyquist-Shannon sampling theorem says that our signal can contain frequency content up to 5 kHz. Then, our frequency bin resolution is:

$$\frac{5\ \text{kHz}}{4096\ \,\text{FFT bins}} \simeq \frac{1.22\ \text{Hz}}{\text{bin}}$$

This is may be the easier way to explain it conceptually but simplified:  your bin resolution is just \$\frac{f_{samp}}{N}\$, where \$f_{samp}\$ is the input signal's sampling rate and \$N\$ is the number of FFT points used (sample length).

We can see from the above that to get smaller FFT bins we can either run a longer FFT (that is, take more samples at the same rate before running the FFT) or decrease our sampling rate.

The Catch:

There is always a trade-off between temporal resolution and frequency resolution.

In the example above, we need to collect 8192 samples before we can run the FFT, which when sampling at 10 kHz takes 0.82 seconds.

If we tried to get smaller FFT bins by running a longer FFT it would take even longer to collect the needed samples.

That may be OK, it may not be. The important point is that at a fixed sampling rate, increasing frequency resolution decreases temporal resolution. That is the more accurate your measurement in the frequency domain, the less accurate you can be in the time domain. You effectively lose all time information inside the FFT length.

In this example, if a 1999 Hz tone starts and stops in the first half of the 8192 sample FFT and a 2002 Hz tone plays in the second half of the window, we would see both, but they would appear to have occurred at the same time.

You also have to consider processing time. A 8192 point FFT takes some decent processing power. A way to reduce this need is to reduce the sampling rate, which is the second way to increase frequency resolution.

In your example, if you drop your sampling rate to something like 4096 Hz, then you only need a 4096 point FFT to achieve 1 Hz bins and can still resolve a 2 kHz signal. This reduces the FFT bin size, but also reduces the bandwidth of the signal.

Ultimately with an FFT there will always be a trade-off between frequency resolution and time resolution. You have to perform a bit of a balancing act to reach all goals.

\$\endgroup\$
2
  • 1
    \$\begingroup\$ Note that you don't have to calculate the FFT. If you only want to know a few bins, it's cheaper to calculate the DFT of just those bins, than to run an optimized FFT which calculates all the bins at once by sharing many of the operations. \$\endgroup\$ Commented Jan 26, 2013 at 0:10
  • \$\begingroup\$ It is also worth noting that a similar frequency/time domain trade-off applies to analog and IIR filters. \$\endgroup\$ Commented Oct 22, 2018 at 5:36
14
\$\begingroup\$

Basic FFT resolution is \$f_s \over N\$, where \$f_s\$ is the sampling frequency.

The ability to differentiate two very closely spaced signals depends strongly on relative amplitudes and the windowing function used.

You may find that playing with the Baudline signal analyzer is a good way to develop some intuition on this matter - and no, running some FFTs and plotting one spectrum at a time in Matlab or Python/Numpy is really not the same.

EDIT: There is also a trick to pad the input with zeros and taking a bigger FFT. It will not improve your differentiation ability but may make the spectrum more readable. It is basically a trick similar to antialiasing in vector graphics.

\$\endgroup\$
0
4
\$\begingroup\$

The frequency resolution does not depend on the length of FFT, but the length of the total sampling time T, i.e. it's 1/T, which is also the lowest frequency component you obtained.

Note, zero padding does not increase the frequency resoltuion; DFT of the zero padding signal is merely a better approximation of the DTFT of the orginal signal.

\$\endgroup\$
1
  • \$\begingroup\$ to sum up, does that mean the lowest frequency is just given by \$ 1/T \$ and the maximum frequency is sampling frequency/2 ? \$\endgroup\$
    – Ben
    Commented Apr 16, 2020 at 13:22
4
\$\begingroup\$

I'll try to explain this in another way. Non 2^n numbers may help. First of all, it's helpful to remember what the FFT (the DFT, basically) does: it multiplies a -windowed- signal with the fundamental cosine (and sine) and the next N harmonics of it that the algorithm creates. In a digital computer, the algorithm creates the cos(2 pi t n) [+ j sin(2 pi n t) but let's leave the sine aside], where t (and not n - n is the harmonic order) is the number of bins. This is the most important part: in a digital computer, t, the time, is quantised in the provided bins. So the computer calculates the cosine of the a -scalar- time value, x harmonic order x 2 pi.

Let's assume a sampling rate of 1kHz; this means that you get one value (voltage, usually) every 1 ms. If we set the bins number to 200, then the longest cosine that is created has a temporal length of 200 x 0.001 = 0.2 s, thus its period is 0.2s, thus its frequency is 5 Hz. This is the cosine that has only one peak and one trough in the entire bins set; it's the f_min. The next harmonic will have two peaks and two troughs, the next harmonic three of each etc. The harmonics will be multitudes of 5, 10, 15 etc. Hz.

If though we had selected 500 bins, then the fundamental cosine would be more expanded: it would have a temporal length of 500 x 0.001 = 0.5 s => f_min = 2 Hz. So in the latter case, the cosines are built up as a series of 2,4,6,8... Thus, we see that increasing the number of bins increased the resolution of the algorithm.

The resolution was increased because the investigating tools of the algorithm, the cosine (and sine) coefficients, are more dense. The input signal is affected only by the sampling rate.

If we invert the multiplications and convert the periods to frequencies, the types of the first post come out.

\$\endgroup\$
3
\$\begingroup\$

It's worth noting that performing an FFT is an alternative to computing a number of separate pairs of sums. An FFT computes the following expression for each complex FFT coefficient \$X_k\$: $$X_k=\sum_{n=0}^{N-1} s_n \cdot e^{-2i\pi k n/N} \qquad k = 0,\ldots,N-1$$ Or, equivalently: $$ X_k = \sum_{n=0}^{N-1} s_n \cdot \mathrm{refcos}_{k,n} + i \sum_{n=0}^{N-1} s_n \cdot \mathrm{refsin}_{k,n}$$ With \$N\$ sample length, \$s_n\$ the \$n^{\mathrm{th}}\$ signal sample, and \$\mathrm{refsin}_{k,n}\$ the \$n^{\mathrm{th}}\$ sample of a reference \$\sin\$ wave with \$k\$ periods over \$[1,\ldots,N]\$.

If one needs amplitude readouts at all those frequencies, an FFT will compute them all in \$\mathcal{O}(n\log n)\$ time, whereas computing them individually would take \$\mathcal{O}(n^2)\$ time. On the other hand, if one only needs amplitude readouts at a few frequencies \$X_k\$, one will often be better off simply computing them individually, especially if one is using a processor or DSP which can efficiently compute that style of sum.

It's also worth noting that while an FFT with e.g. a 20ms sampling window won't be able to distinguish between a single 1975Hz tone, or a combination of frequencies (1975-N)Hz and (1975+N)Hz for N<25, it can be used to measure isolated frequencies with accuracy finer than the sampling window if there is no other spectral content nearby. A lone 1975Hz frequency will pick up equally in the 1950Hz and 2000Hz bins, as would a combination of 1974Hz and 1976Hz tones. An isolated 1974Hz tone, however, would pick up more strongly in the 1950Hz bin than in the 2000Hz bin, and a 1976Hz tone would pick up more strongly in the 2000Hz bin.

\$\endgroup\$
1
  • \$\begingroup\$ I edited your answer to add math formatting and clarified the computation and relationship with FFT. I checked that both expressions were indeed equal and mathematically sound, but the original had a few confusing differences: "up to half the sample length" instead of N-1 for both sums (thereby discarding half the input samples), and inconsistent Sample[j] and Sample[k]. I'm assuming this was a simple mistake and typo, but could you please clarify/edit back if not? \$\endgroup\$
    – MayeulC
    Commented May 31, 2023 at 9:22
0
\$\begingroup\$

If you know the range of possible input frequencies, and the range is narrow, you may apply undersampling to reduce the number of samples and the time to compute the FFT. With 256 samples and a sample frequency of 256 Hz, you get the wanted 1-Hz resolution and an alias-free bandwidth of 128 Hz.

\$\endgroup\$
0
\$\begingroup\$

I think the last image is quite clear except for one correction. The bottom of the image should be Fs/2 instead of Fs

This is my experience with MATLAB FFT calculations: if you sample a sine wave at 8000 Hz for a duration of 20 seconds you will collect 8000x20= 160,000 samples when you perform FFT calculation a matrix of 160,000 rows and two columns will be created by MATLAB. first column will be an array from 0 to 4000Hz at the step of 0.025 Hz (4000/160000) and the second column will be the power density of that frequency So the resolution in this case will be 0.025 Hz and the resolution will be :

Res = [Fs/2]/N N= duration (s) x Fs (Hz) ==> Res = (Fs/2)/(duration x Fs)= 1/(2 x Duration)

So for yor example if you want to distinguish 2000 Hz from 1999 Hz your resolution should be at least 1 Hz ( I would say 0.5 Hz for more reliable result)

so yo should sample at least at 4000Hz for a duration of 1 sec (4000 samples) to get 0.5 Hz resolution and duration of 0.5 sec (2000 samples) to get 1 Hz resolution If I was you I increased duration to 5 sec to get a resolution of 0.1 Hz. In this resolution you can easily distinguish 1999Hz, 1999.1 Hz, 1999.2 Hz etc

\$\endgroup\$
-4
\$\begingroup\$

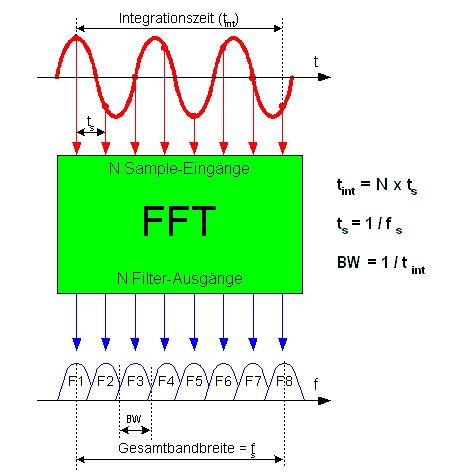
look at this pic. its clear. relation between fs and fft resolution

enter image description here

\$\endgroup\$
1
  • 6
    \$\begingroup\$ It's not totally clear from this picture what's going on. (It doesn't help that the picture isn't in English.) What does this add that the other answers haven't mentioned? \$\endgroup\$
    – Greg d'Eon
    Commented Nov 9, 2015 at 13:17

Your Answer

By clicking “Post Your Answer”, you agree to our terms of service and acknowledge you have read our privacy policy.

Not the answer you're looking for? Browse other questions tagged or ask your own question.