1
\$\begingroup\$

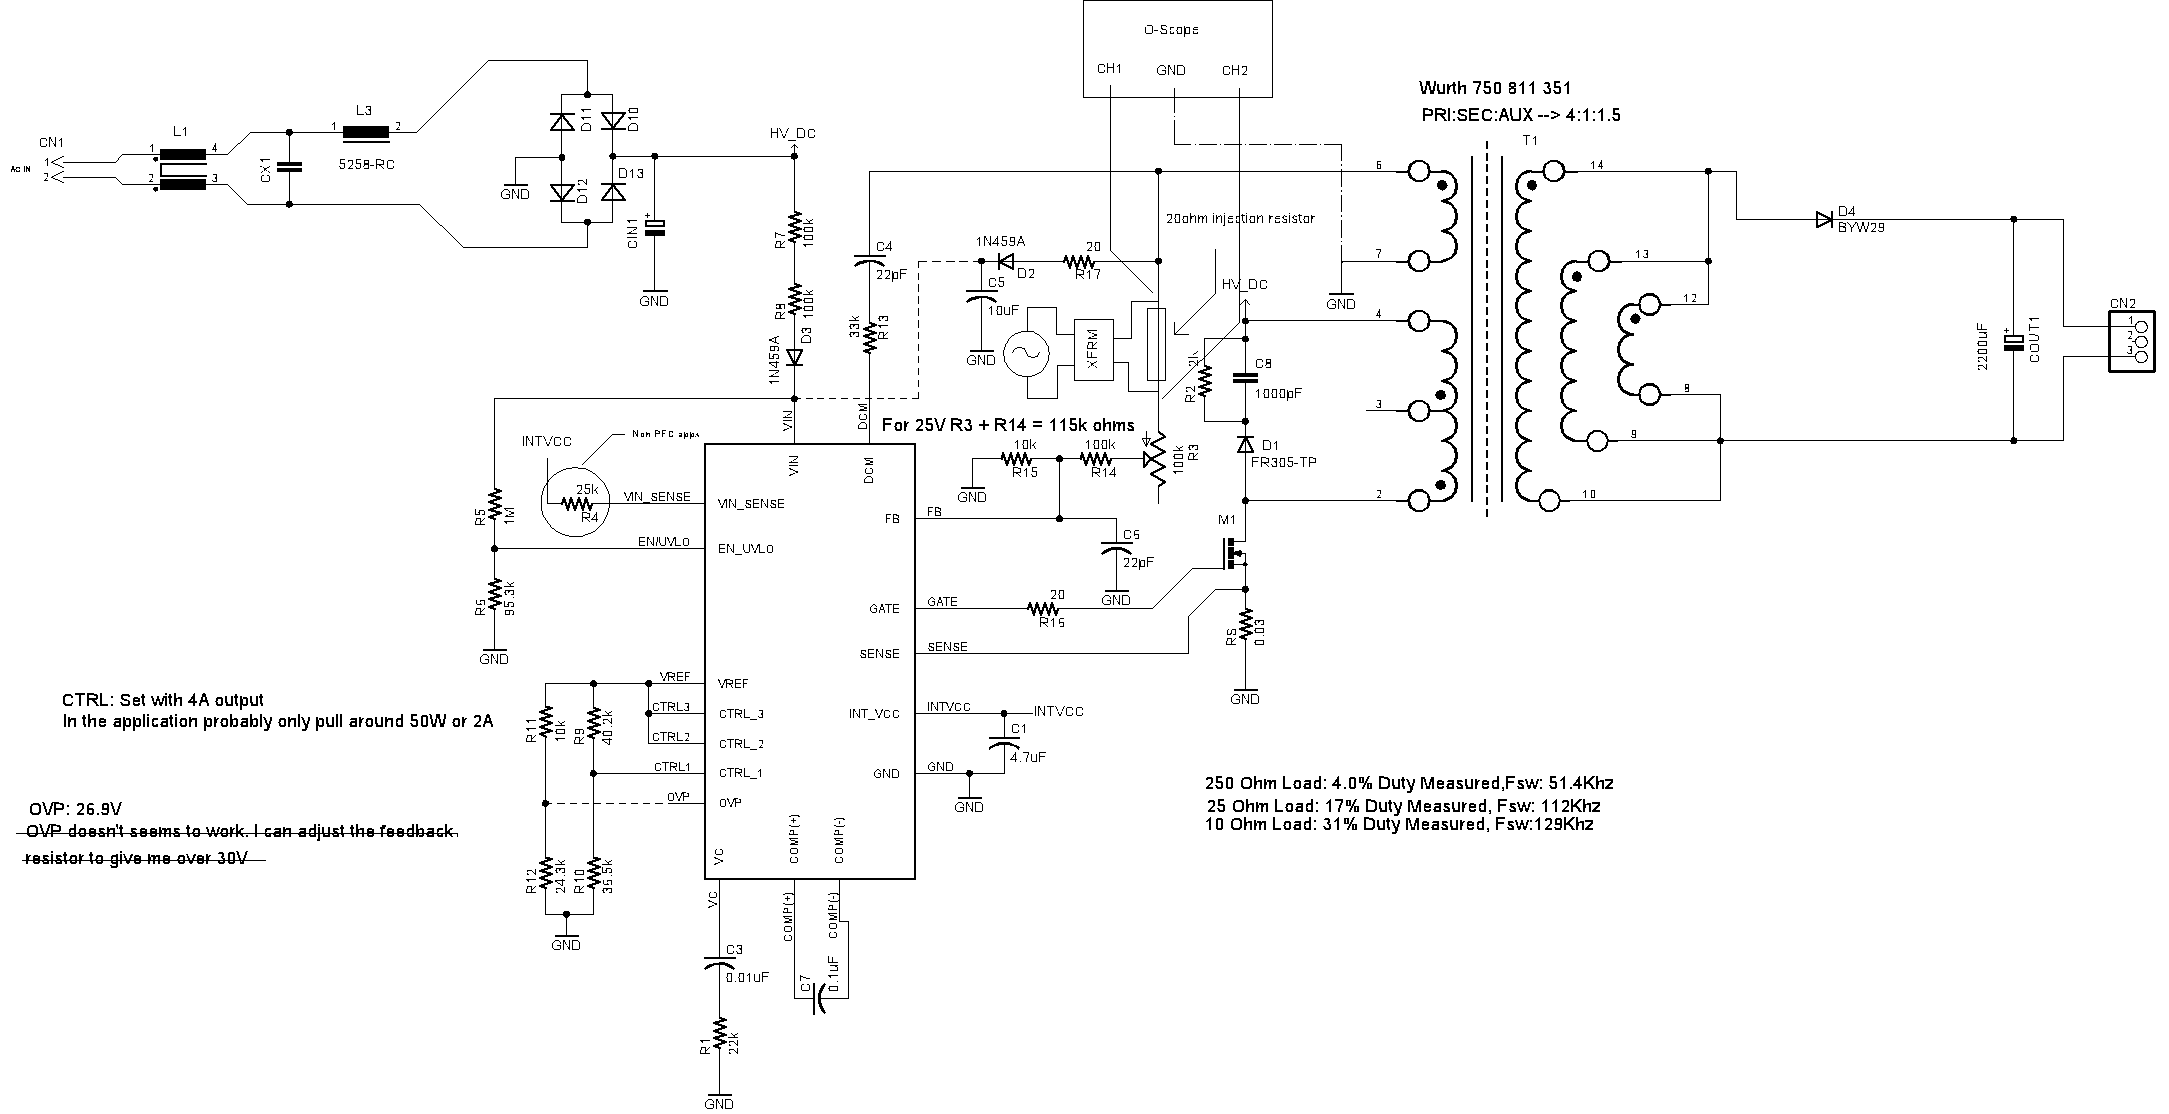
I have a flyback converter based of the LT3798. The converter takes a rectified AC (120Vac,60Hz) and steps it down to 24Vdc. It uses a third winding on the transformer to power the IC and to generate a feedback voltage.

I basically followed the spec sheet's design examples and I now have a working prototype. It seems to work well as it regulates the output voltage at 24V with a load of 750 ohms to 10 ohms. The output does get a bit a noise/ripple on it with the 10 ohm load. That may be able to be fixed with a larger capacitor or LC filter on the output. Something I plan to test later.

What I am curious about is how to measure the gain and phase margin. I do not have a vector network analyzer, but I have seem where you can use an o-scope to to measure the amplitude and phase difference between an injected signal. This is what I am trying to accomplish now. The only problem is that most of the examples I have seen show an injection point that starts at the output of the converter and is in series with some kind of feedback resistors. Mos examples are similar to this: Measurement Setup
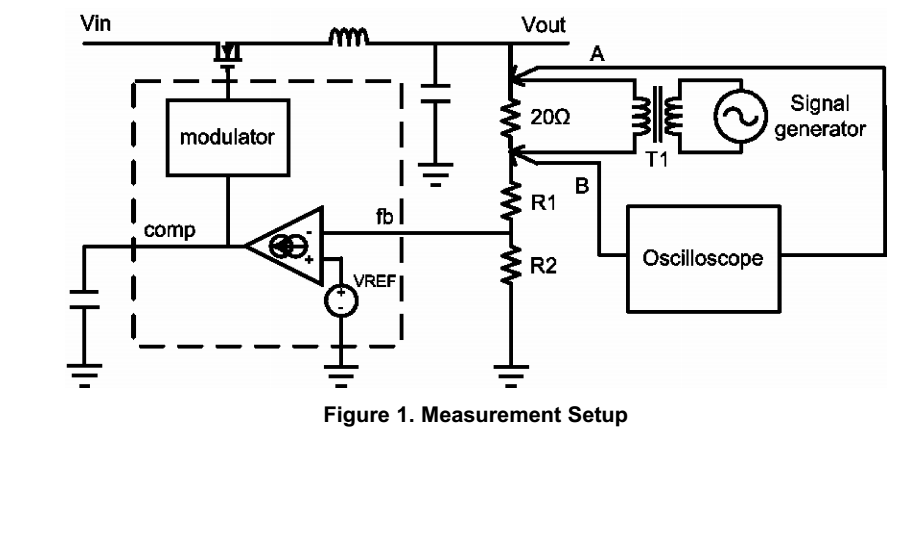
I understand this. The ac signal "rides" on the dc voltage and causes a disturbance in the feedback loop. Lots of examples on the web that show/explain this.

The problem I am having with my circuit is that the feedback path for the voltage is through a third winding and is not a steady dc voltage.

Can the same technique used in Figure 1 be used on my circuit?

I am using a 120Vac to 16Vac, 60Hz transformer (TRIAD FD5-16) for the injection transformer. I have somewhat of a frequency characteristic chart that I made by using a function generator and measuring the amplitude on the input and output of the transformer at different frequency. I figured I could use that to compensate for the lack of flatness over the a wide frequency range.

Here is my shcematic: enter image description here

I would really like to be able to measure the phase and gain margin. Not just to check for stability, but at this point it is somewhat of a learning experience!

I have read that you can capture the output of the converter after a load step to see if there is any overshoot and that will tell you if the system is stable. Is that the method that I should be using? Can anyone point me in the right direction?

Thanks in advance

\$\endgroup\$
7
  • 1
    \$\begingroup\$ Can you make a Log sweep generator? ( Audacity is free) Can you make a phase detector? ( HC4046 or similar )Can you make a precision peak detector? (Op Amp ) Then the low side of 20R is a constant log sweep and the response is the opposite phase and amplitude output or high side . AC couple then linear rectify from 10Hz to 10kHz (0dB) and plot linear phase on Ch2 using type II detector. I prefer S&H on sawtooth derived from square wave. To get a true Bode Plot log-log , you need a 4+ decade log amp on the envelope detector. \$\endgroup\$
    – D.A.S.
    Commented Dec 31, 2016 at 1:27
  • 1
    \$\begingroup\$ Put that all together or just input both to a DC coupled audio amp into Audacity and get log-log spectrum ( poor man's Bode plotter) Otherwise use scope to measure export and plot in Excel or Matlab. \$\endgroup\$
    – D.A.S.
    Commented Dec 31, 2016 at 1:27
  • \$\begingroup\$ Tony - Thank you for taking time to respond to me. I will have to look into the technique that you are talking about with the log sweep generator. I haven't seen this method used, but coming from me that doesn't mean much! \$\endgroup\$
    – user134575
    Commented Dec 31, 2016 at 15:13
  • \$\begingroup\$ @Tony Stewart. EE since '75 - !Right now I have all the equipment to use a scope and frequency generator to inject a signal and watch the response on the scope. I have tried this, but I can't seem to get a good reading. Partly because the third winding, where the feedback voltage comes from, is not dc. The voltage comes out of the third winding at around 45V peak to peak with lots of ringing. I am pretty sure this is typical and nothing to be alarmed about it just makes it hard to see an injection signal. I tried pushing a 303Vp-p signal and still didn't see anything it on the scope. \$\endgroup\$
    – user134575
    Commented Dec 31, 2016 at 15:28
  • \$\begingroup\$ It suppose to say 3.3Vp-p. For some reason it won't let me edit my comment. \$\endgroup\$
    – user134575
    Commented Dec 31, 2016 at 15:30

1 Answer 1

-2
\$\begingroup\$

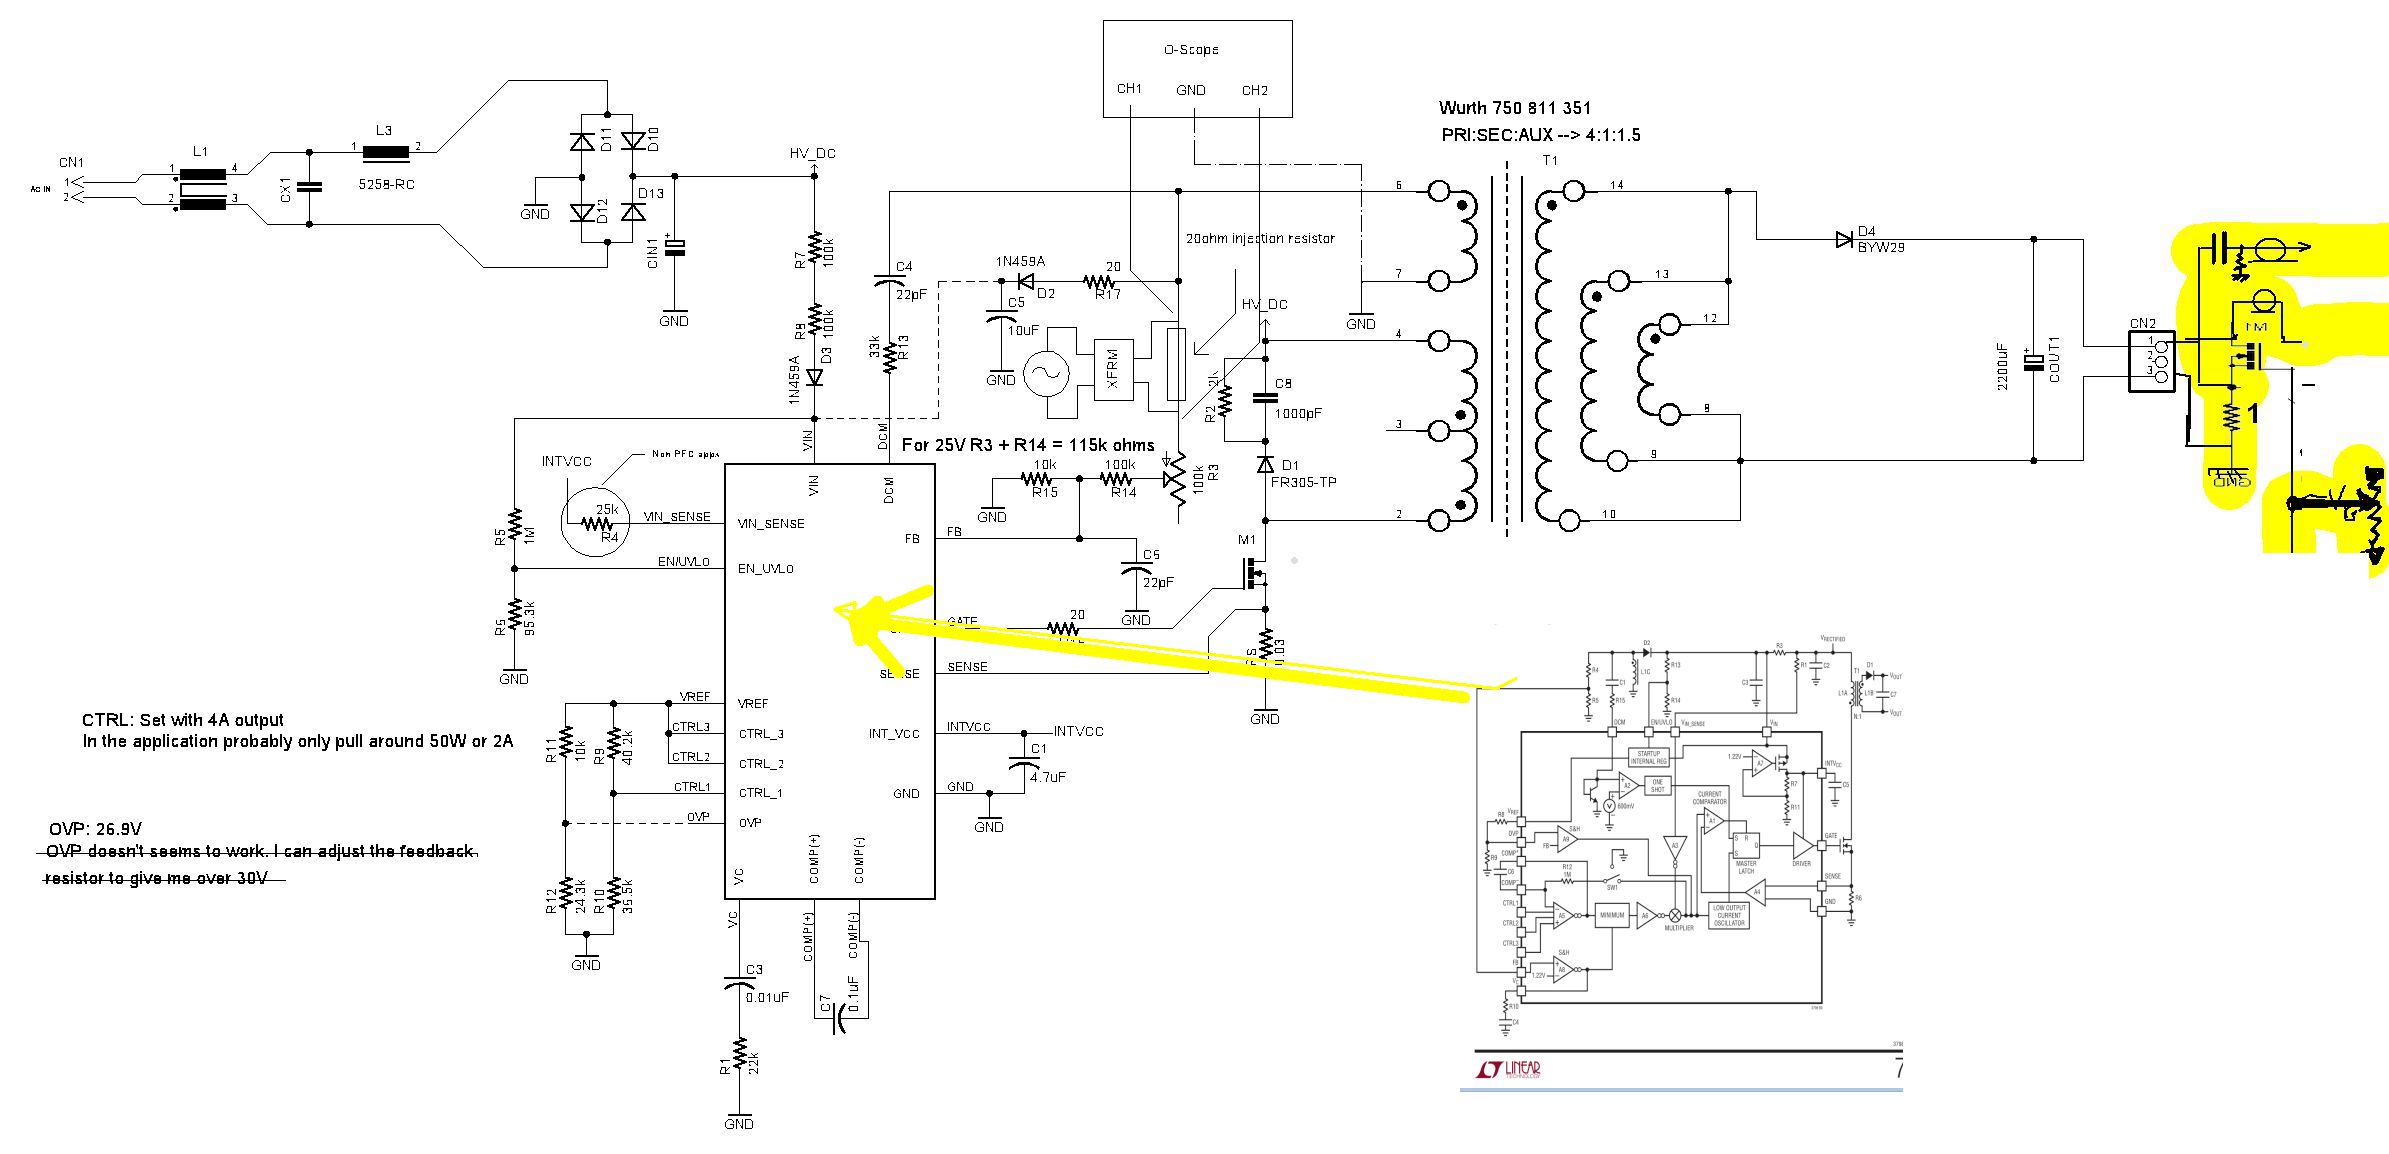
with points you get more edit privies.... I honestly am not sure the best way to Bode Plot this non-linear current-mode dual feedback path switching regulator in an analog open loop voltage gain transfer function. So I think the best way is to measure the current loop on secondary. Injecting a sinusoidal current over a DC load current and measure the voltage response on the output. With the assumption of injecting a linear sweep f error voltage I would use a biased MOSFET and a resistive load in shunt.

I realize this is more of a z22 plot than a s21 plot.

But there is no single feedback point and FB is PAM modulated goes inside to a S&H and mixed with tertiary zero-crossing current sense to a set-reset flip-flop to control PWM.

So try this and consider a 1 Ohm active load sense with a pot to change the operating DC load and add various levels of AC load from 10% full scale to 25% to 50% with a 10% static DC load to improve stability. Then plot the z22 response whereas the inverse y22 is the load regulation error as a function of frequency using your DSO & excel. The Audacity log sweep is useful here.

enter image description here

\$\endgroup\$

Your Answer

By clicking “Post Your Answer”, you agree to our terms of service and acknowledge you have read our privacy policy.

Not the answer you're looking for? Browse other questions tagged or ask your own question.