4
\$\begingroup\$

I've been quantifying the peak to peak level of noise on a 24V Zener diode. The noise distribution is log normal, consistent with the literature regarding avalanche effect. The apparatus is:-
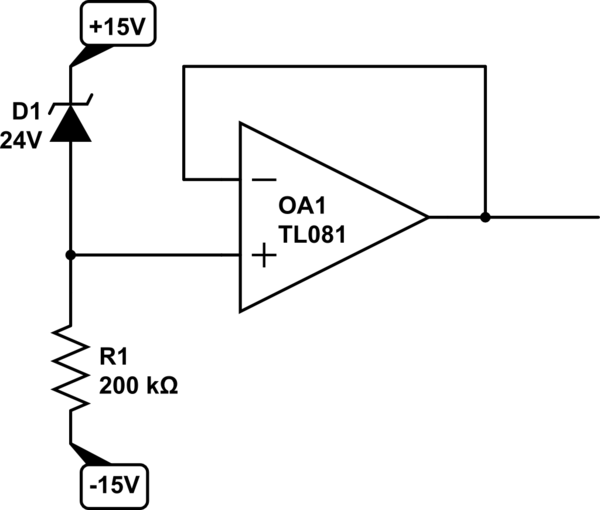
schematic

simulate this circuit – Schematic created using CircuitLab

I've asked previously regarding this, as How to measure the amplitude of noise and What is the noise level as read on my oscilloscope and not had satisfactory answers that matched my experiences. Traditionally noise is measured in V/√Hz. I suggest that this was the only means as people only had analogue oscilloscopes with smooth continuous traces. They kinda stuck their thumb on the bit of the screen where the trace topped out, and looked at the 'scope settings. This became the norm.

We now use digital scopes. This has changed everything. For noise measurement on a DSO, there is no concept of noise /bandwidth, and no concept of bandwidth actually. The peak to peak level of noise only depends on the total number of samples taken. These samples can be taken at 1 sample /s or 1Gsample /s and this makes no difference to the peak to peak reading (and thus the rms value). This is entirely consistent with statistics based on discrete sampling.

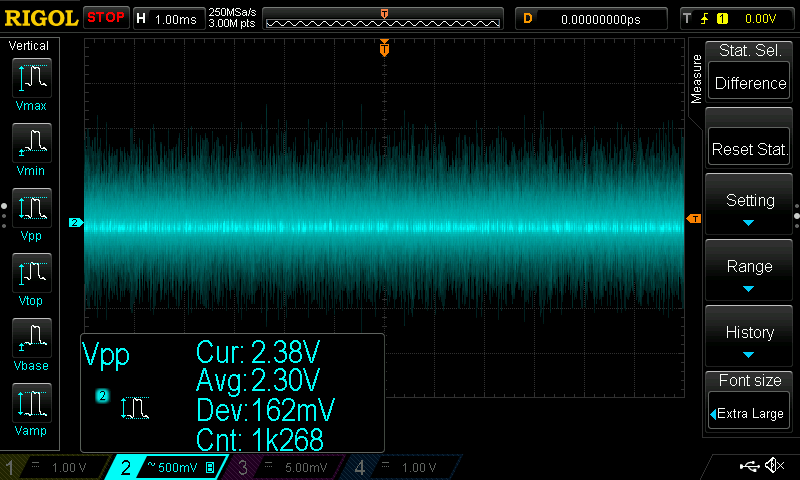
DSO capture

This is what I get. The mean Vpp and standard deviation do not change if you vary the oscilloscope bandwidth by applying the 20MHz limiter. The op amp is rated to 3MHz so this is fixed at all times. The only thing that affects these readings is the total number of samples taken. With a mean of 2.30V and a standard deviation of 162mV, I can calculate any peak or rms value within a certain confidence level.

The crux is this: Noise is a normalish statistical distribution. A distribution is entirely defined by shape, size and position. So we have log normal, μ = 2.30V and σ = 162mV. I cannot for the life of me see how that correlates to an x V/√Hz value, especially since the Hz bit refers to the measuring instrument, and not the source. Surely the source makes noise irrespective of the measuring apparatus? Or is it a case of "Does a falling tree make a sound..?"

Given that very most new oscilloscopes are digital with discrete sampling, should we now drop V/√Hz in favour of a statistical approach to noise measurement?

\$\endgroup\$
11
  • \$\begingroup\$ And what number should be quoted by TI, ADI, LT, MAXIM etc. in their data sheets? \$\endgroup\$
    – Andy aka
    Commented Jan 26, 2017 at 15:09
  • 1
    \$\begingroup\$ How do you know that there is not something else limiting your bandwidth, such as the junction capacitance of the zener? Ill bet if you brought the bandwidth way down, say kHz (with an external filter) your peak to peak noise would drop. \$\endgroup\$
    – user4574
    Commented Jan 26, 2017 at 15:13
  • 4
    \$\begingroup\$ en.wikipedia.org/wiki/Johnson%E2%80%93Nyquist_noise is measured in V/√Hz because that's how the maths work for the physical property itself. \$\endgroup\$
    – pjc50
    Commented Jan 26, 2017 at 15:47
  • \$\begingroup\$ Are you saying Acquisition mode Mem Depth up to 3Mpts increases the noise levels for mean or std.dev? Did U use Peak or normal detection? \$\endgroup\$
    – D.A.S.
    Commented Jan 26, 2017 at 19:36
  • 1
    \$\begingroup\$ "all new oscilloscopes are digital" That's just not true. \$\endgroup\$ Commented Jan 26, 2017 at 19:53

4 Answers 4

14
\$\begingroup\$

No, V/rtHz still matters.

I suspect the mistake you're making is to think that sampling at 1Hz reduces the bandwidth of the input signal. It doesn't, it just undersamples it.

Now if your noise source is truly broadband, then the 20MHz limiter would reduce its amplitude. If it doesn't, that suggests the noise is band limited to something less than 20MHz. Which is consistent with my understanding of an avalanche effect Zener diode.

Make up a 1 kHz R-C filter and try again.

\$\endgroup\$
6
  • \$\begingroup\$ Plus, it isn't just about the measurement method -- it's the only way that the math works, too. \$\endgroup\$
    – Dave Tweed
    Commented Jan 26, 2017 at 22:54
  • \$\begingroup\$ Yes especially comparing noise between circuits of different bandwidths. \$\endgroup\$
    – user16324
    Commented Jan 26, 2017 at 23:28
  • \$\begingroup\$ If you're right, you'll be able to tell me the peak voltage I can expect after 100 samples of a 1V/√Hz source won't you? \$\endgroup\$
    – Paul Uszak
    Commented Jan 27, 2017 at 0:36
  • \$\begingroup\$ I've used an Arduino sampling at 10s /s. The diode should be able to manage 10Hz. Yet I still get exactly the same result after 12,000 samples as using the scope with a memory depth of 12K. \$\endgroup\$
    – Paul Uszak
    Commented Jan 27, 2017 at 1:19
  • 1
    \$\begingroup\$ This is exactly the same aliasing situation as undersampling any analog signal. After you have scrambled the frequency response of the sampled data, you can't unscramble it again. Any calculations using the scrambled data need careful interpretation - and "careful interpretation" is sometimes a euphemism for "meaningless garbage"! \$\endgroup\$
    – alephzero
    Commented Jan 27, 2017 at 4:56
6
\$\begingroup\$

Noise measurements depend greatly on the instrument measurement method.

Results will change depending on setup for Acquisition Mode> Real-time, MemDepth and Sinx/x.

A DSO does not integrate the signal uniformly over the time interval between samples, therefore it does not reduce the signal level with sweep speeds or sampling rate.

Therefore you must understand what it means to have \$V/\sqrt{Hz}\$ from a zener before you propose that we need another method.

Thus your Zener noise is constant and measurement interpretation is incorrect.

EDIT from recent schematic, Random Noise power, I estimate from TL081 spec of BW=3MHz with Vpp/8=Vrms then take Pd=Vrms^2/R for R=200k and Noise density as N=Pd/√BW thus dB/Hz= 10 log ( Vrms²/R * 1/√BW) [dB/Hz]

A Spectrum Analyzer uses an adjustable yet fixed IF BW for the sweep but random noise can be reduced further with the video filter BW.

In other measurement instruments like chromatography and spectroscopy manufacturers are leaning towards defining the confidence factor, \$t_a\$ and or the relative standard deviation RSD with Standard Deviation STD and Mean value where \$RSD=\frac{\sigma}{\bar{x}}\$

We know that averaging digital samples with random noise lowers the standard deviation by the \$\sqrt n\$. This is equivalent to increase sample integration value or reduction of √bandwidth which is still valid for V/√Hz but does not apply to your sample rates. The instrument is specifically designed for maximum signal BW in order to capture transients.

It is up to you to limit the signal BW. If this signal exceeds 1/2 of sample rate when you choose a slower than maximum rate , you can expect aliasing errors on repetitive signals and little or no change in Zener noise levels. These types of variable speed ADC's with adjustable BW with conversion rate use Integrate and Dump Converter (IDC) methods and are not as fast as S&H SAR or Flash ADC measurements used in DSOs.

It is this feature that allows Shannon's Law to appear to be exceeded by having a wide signal bandwidth and small sample duration yet at slow sample rate. i.e. sample duration and ADC resolution determines Bandwidth beyond the sample rate.

Misc detail.

The sample time or interval must satisfy Shannon's limit in order to expect error free results and meet instrument accuracy. This means for an uncertainty of \$10^{_-x}\$ using a resolution \$10^{_-y} ~\$where\$ ~^{y > x} \$ or in log terms the uncertainty is \$-10x ~~\$[dB] This means the noise in the analog bandwidth, B must be less than this which includes Shannon's sampling theorem for the band stop attenuation of signal. Thus although some DSO's do adjust B to prevent aliasing distortion with slower sampling rates, evidently yours does not. So the sample time is still small ( related to Shannon-Nyquist filter B ), allowing wide bandwidth measurements even at long sample intervals.

\$\endgroup\$
4
  • \$\begingroup\$ Does Shannon apply to noise? We are interested in the max. rms /Vpp usually for noise effects. Doesn't the sampling theorem only apply if we wanted to draw an accurate waveform trace? \$\endgroup\$
    – Paul Uszak
    Commented Jan 27, 2017 at 1:23
  • \$\begingroup\$ Take a zero distortion sine wave at 1kHz. Shannon says we need to sample at > 2 ks/s to draw it accurately. Yes, I agree. But to find the Vpp? We can sample at any rate what so ever, say 1 s/s. After 1000 samples, we will have our Vpp with a confidence of 99.9% won't we? Shannon does not apply in the Vpp case therefore. \$\endgroup\$
    – Paul Uszak
    Commented Jan 27, 2017 at 1:26
  • \$\begingroup\$ So your scope decimates or averages the realtime sample rate when reducing the sample size which reduces random noise \$\endgroup\$
    – D.A.S.
    Commented Jan 27, 2017 at 2:05
  • \$\begingroup\$ the (max) half bandwidth is defined by the inverse of the sample duration and not the rate, which makes all the difference why the amplitude stays constant for a fixed buffer size. Curious though how the noise reduces with smaller buffer in time domain, yet I expect noise to reduce in FFT with a larger buffer. That's appears to be how it works with smaller (f) bin size yet it time domain it decimates by averaging. \$\endgroup\$
    – D.A.S.
    Commented Jan 27, 2017 at 17:43
2
\$\begingroup\$

The real error you're making here is that you're conflating the concepts of statistics of the samples and the amount of signal power that those samples represent. SNR is by definition a ratio of signal power to noise power.

The sample statistics depend only on the PDF (probability distribution function) of the signal, and not on anything having to do with time, such as bandwidth or sample rate, as you have noted.

But in order to say anything about the power of the noise, you need to add information about its bandwidth, and you won't get that from the statistics of a time-domain oscillogram. You need to do a frequency-domain analysis (e.g., an FFT) in order to determine the PSD (power spectral density) of the signal.

PSD is measured in terms of watts/Hz, and if you want to think about it in terms of voltage or current, you need to remember that power is proportional to volts squared or amps squared, which is why you end up talking about volts/√Hz or amps/√Hz.

It really is implicit in the math, and has nothing to do with any particular measurement method. But you do need to understand how the measurements you're making relate to the theory.

\$\endgroup\$
1
  • \$\begingroup\$ I've not used the Rigol PSD but is it shown in dB/Hz? \$\endgroup\$
    – D.A.S.
    Commented Jan 27, 2017 at 2:39
0
\$\begingroup\$

Having reviewed answers I'm convinced that actually, they're the same thing just expressed differently. I'm not certain of watts /Hz, but certainly for simple amplitude of a noise signal there is no significant difference between V/√Hz and a μ, σ statistical representation. They're just two sides of the same coin.

The winning evidence came from EEVblog Dave's noisy digital oscilloscope explanation. Look around 6 min 50s. Noise drops as memory depth drops. This is what you expect statistically and what I've found with my Rigol. He used a Tek 3000 series model costing considerably more. Bandwidth on a DSO is actually closely related to sample rate through Shannon's sampling theory. Therefore a 20 MHz bandwidth is actually represented by sampling at 40 MSa/s. The fundamental point of my argument is that the 40 million samples can be taken over any time period. The peak noise voltage will be the same.

An intuitive expanation is: simple measurement bandwidth cannot be a factor in noise level, as that would mean that my diode's avalanche effect is dependant on the plastic oscilloscope and rubber leads connected to it. This is counter intuitive. The avalanche noise characteristic of a diode must surely only depend on the manufacture of the diode, it's temperature and current flow. Not what kit I have in the room next to it. The statistical model meets this criteria.

A μ and σ model works better for my situation. With a mean of 2.30V and a standard deviation of 162mV, I want to calculate the maximum expected noise voltage with a confidence of 99% (100 samples taken over any time period). This is elementary statistics which leads to an expected noise voltage reading of 2.72V. I can see no way to calculate this quantity using the old (obsolete?) V/√Hz model as I have no frequency, only a number of samples.

\$\endgroup\$
1
  • \$\begingroup\$ simple measurement bandwidth cannot be a factor in noise level - of course not, the physical process is contained in the diode. But the measurement bandwidth has a big effect on the measured noise level. \$\endgroup\$
    – tomnexus
    Commented Feb 8, 2017 at 4:39

Your Answer

By clicking “Post Your Answer”, you agree to our terms of service and acknowledge you have read our privacy policy.

Not the answer you're looking for? Browse other questions tagged or ask your own question.