1
\$\begingroup\$

What I am doing

I built a circuit using a 555 timing chip in astable mode which produces a square wave. There is a potentiometer which allows me to adjust the frequency produced.

One aspect of this circuit is that the square wave is always uneven, i.e., the high and low times are different:

time_high = 0.693 * (r1 + r2) * c1
time_low  = 0.693 * r2 * c1       
fequency = 1 second / (time_high + time_low)

This difference is smallest when R2 is significantly higher than R1.
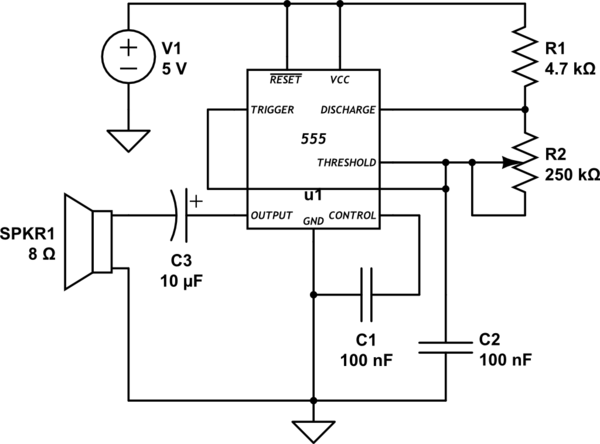
schematic

simulate this circuit – Schematic created using CircuitLab

What I am observing

When I used an audio microphone to record the output of the circuit. I generated frequency graphs for different sections of the recording. I noticed that at a given R2 position there are two spikes and at other R2 positions there sometimes many more (spikes meaning the circuit is producing a wave at that frequency).

Initially, I was not able to explain this, however, now I am suspecting that these overtones are produced from the relationship of the speaker load and the square wave. (This is why the overtones do not appear in a circuit simulator.)

In other words, when the voltage moves from high to low, the speaker cone is not able to change with the same speed because of its air resistance and mass. If the square wave had a perfect 50% duty cycle this "rounding" effect would be balanced between each push and pull. Since my circuit is asymmetric, perhaps the speaker cone is never pushed fully out when the voltage is high before the voltage goes low and starts to pull the speaker cone back. This, in my head, seems like it would create little humps on the waves.

My question:

I kind of just want some thoughts on this. Does what I am saying make sense? If so, is there a name for this effect? If I am correct, could someone point me to an article about this?

Update:

Here are the spectrum graphs side by side at two different knob positions. You can see that on the left (238 Hz) there are some overtones but they are modest in relation to the spikes when the circuit is generating a higher frequency wave (771 Hz).

Additionally, considering the formulas, the lower frequency wave is more symmetric than the higher the frequency wave. This is because R2 is > 100x the difference of R1.

Spectrum Analysis

Further Question:

I understand that jitters in the square wave will produce "overtones", however, does the speaker load affect it? Can someone speak to that?

This wave form looks nothing like a square wave. It looks like a bunch of sign waves. Which makes sense because a speaker cannot make a "square wave," right?

enter image description here

Also, why are there such strong differences between the graph of 238 Hz and 771 Hz?

\$\endgroup\$
6
  • \$\begingroup\$ Also, when I tested this initially, I didn't have the C3 cap. That is there to make the wave actually drop below 0 - I realize it no longer makes a square wave... \$\endgroup\$
    – Tim
    Commented May 17, 2017 at 19:14
  • \$\begingroup\$ Do you have an oscillogram? \$\endgroup\$
    – winny
    Commented May 17, 2017 at 19:35
  • \$\begingroup\$ One moment... Although, this is going to be a microphone recording... with an audio application doing the frequency analysis \$\endgroup\$
    – Tim
    Commented May 17, 2017 at 19:36
  • 1
    \$\begingroup\$ It would be helpful to provide the dominant frequencies you are observing and some relative magnitudes. If you are observing a significant change in odd integer multiples (1, 3, 5, 7, etc.) Then that says one thing. If instead you are seeing something interesting on even multiples, that may say some more about something else. Since you are just looking for thoughts, it is best to provide something upon which people might "resonate." In short: provide some data. \$\endgroup\$
    – jonk
    Commented May 17, 2017 at 19:42
  • 1
    \$\begingroup\$ The Z(f) on all speakers can be very distorted, so current will be very distorted. You are effectively measuring the impedance on the harmonic content. Try a 20uS pulse at 10 pps. then record the current with 0.1 Ohm shunt in AUX in and look in Audacity \$\endgroup\$
    – D.A.S.
    Commented May 17, 2017 at 20:13

4 Answers 4

1
\$\begingroup\$

To go along with some of the other answers: An "ideal" 50% duty cycle square wave will have infinite harmonics at the odd-integer frequencies above the fundamental frequency. As you change the duty cycle, there will be a shift of even-integer frequency harmonics added in, etc. Modifying the value of R2 in your circuit not only changes the frequency but also the duty cycle at the same time, so you will observe not only the Pulse Width Modulation effect (and frequency change) but also the change in the resulting harmonics.

\$\endgroup\$
2
  • 1
    \$\begingroup\$ Jesse, you and I seem to be on the same page!!! :) Two nights ago I set up a test to try to gather more information. I created four different waves at the same frequency with different duty cycles to determine if there were more overtones. Specifically, 10%, 16.7%, 25% and ~50% @ ~240 Hz, and the spectrum graphs looked almost identical. I really think you and I are correct, that is why I am setting up more tests. at a higher frequency. I think that the speaker resonance is playing an equal part as well. \$\endgroup\$
    – Tim
    Commented May 19, 2017 at 20:02
  • 1
    \$\begingroup\$ Seriously, Jesse, you are the only person that seemed to be understanding what I was saying... Thank you! \$\endgroup\$
    – Tim
    Commented May 19, 2017 at 20:05
4
\$\begingroup\$

First, you can easily make a nice square wave from any duty cycle pulse train by running it thru a toggle flip-flop. That's basically using it as a 1-bit counter. That divides the frequency by 2, so you compensate by doubling the pulse train frequency.

To your question, every sharp edge contains lots of high frequencies. Especially if the pulse frequency is long enough, then the speaker could be resonating for a little while at one of those frequencies. Better speakers would do this less, but all speakers have some resonances somewhere.

One way to deal with this is to low pass filter the square wave before using it to drive a speaker. Certainly filtering anything you can't hear anyway is free, but often there is a lower upper bound on legitimate frequencies. You still get lots of harmonics from low frequency square waves before the filter kicks in, but those are what makes the result sound like a square wave instead of sine wave or some other wave shape.

\$\endgroup\$
1
\$\begingroup\$

Use the 555 in the square wave configuration where the output drives the charge and discharge line as shown below. It won't be totally square but should be consistent with frequency.

schematic

simulate this circuit – Schematic created using CircuitLab

Apologies for backwards schematic.... Symbol in the library is backwards.

ADDITION

However, if harmonics are your issue you may want to buffer, filter and amplify the triangle wave at the top of C1 and feed THAT to your speaker instead of the sharp edges from the square wave.

\$\endgroup\$
2
  • \$\begingroup\$ Thanks for the answer. It is almost square in the simulator... I am talking about in practice, there being overtones when I look at the frequency produced. I assume this is due to the introduction of speaker load ... looking for someone to confirm. \$\endgroup\$
    – Tim
    Commented May 17, 2017 at 20:01
  • \$\begingroup\$ @varlogtim overtones as you call them are caused by the sharp edges on the square wave.. see my add to my answer \$\endgroup\$
    – Trevor_G
    Commented May 17, 2017 at 20:02
1
\$\begingroup\$

When I was designing a 10MHz synchronous data and clock recovery circuit in the early80's , I was very concerned about clock jitter and asymmetric. "sliced" data.

My requirement for the data slicer of AM 101010 and 11001100 was the same 50% duty cycle +- 0.5% for a wide range of signal amplitudes and temperature. Not having a DSO, or precision TI counter, I decided to use a spectrum Analyzer like you and correlate 1st even harmonic with symmetry.

Then I could measure asymmetric directly off SA . I forget the values but it was something like 2f= -22 dB relative to 1f. You can calibrate yourself. Of course -60dB might be 0.05% error or something like this was overkill but you can take a /2 FF clock out to get this with rise time symmetry to fall time.

Errors come from skew in bias and rise/fall time and current limit symmetry , as well,as comparator offsets in your case.

A priori: Define your spec tolerance and conditions.

\$\endgroup\$

Your Answer

By clicking “Post Your Answer”, you agree to our terms of service and acknowledge you have read our privacy policy.

Not the answer you're looking for? Browse other questions tagged or ask your own question.