4
\$\begingroup\$

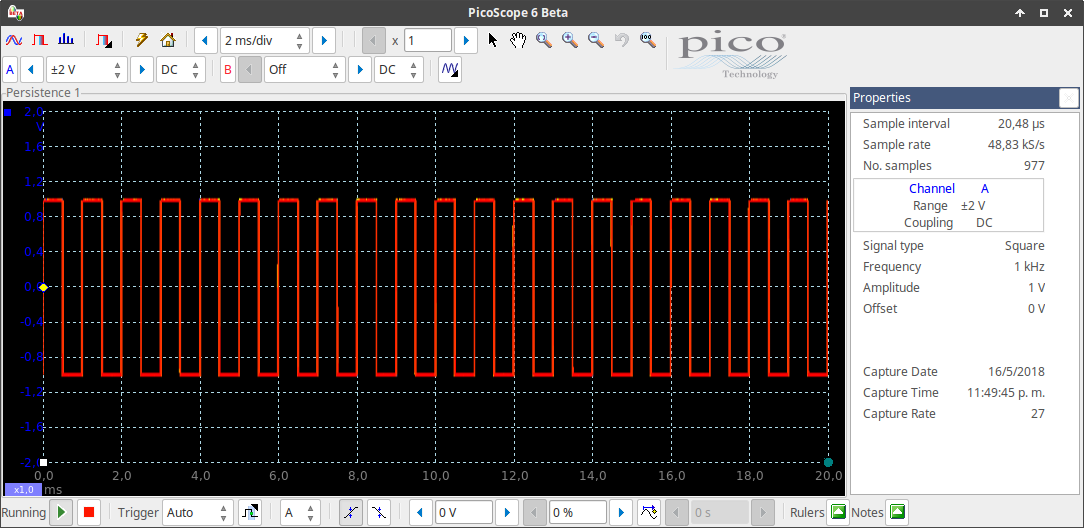
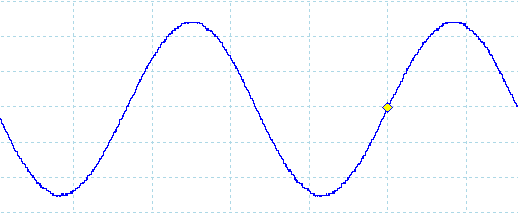
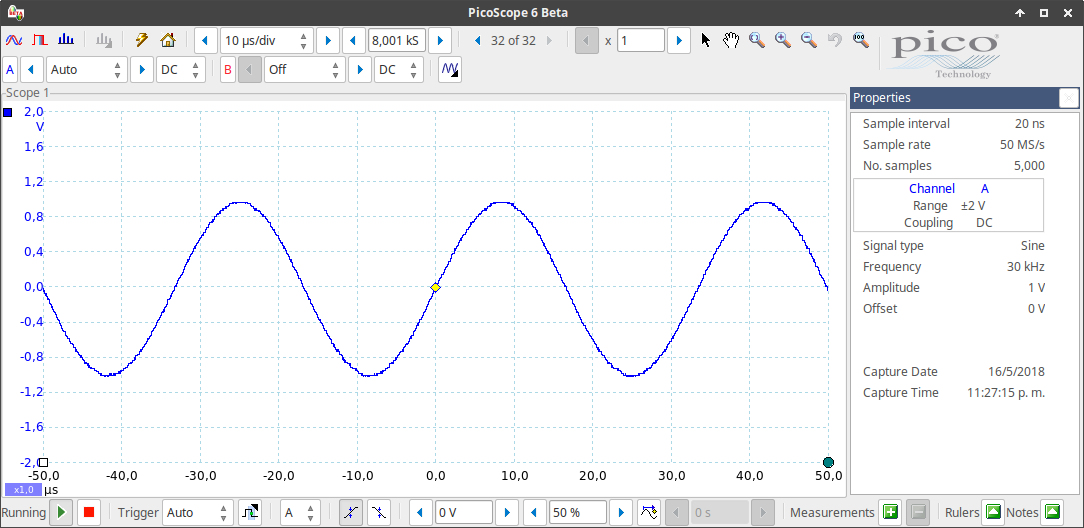
I am sampling a sinusoidal signal with an oscilloscope and viewing its spectrum using the FFT mode. The signal in time domain is this:

enter image description here

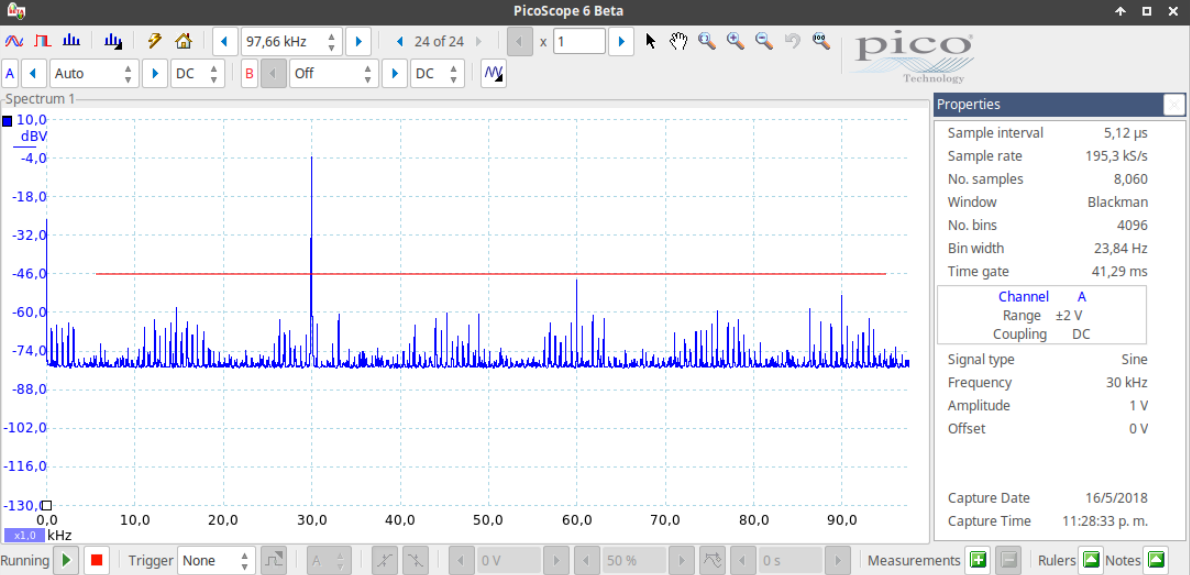
and I am getting this spectrum:

enter image description here

The peak above the red line is clearly the 30 kHz sine signal but, what are all those peaks below the red line? They are clearly not harmonics of my signal... There are peaks even at frequencies below the fundamental... Might this be caused by aliasing? Or what is this?

EDIT:

If the input is a square wave like this one:

enter image description here

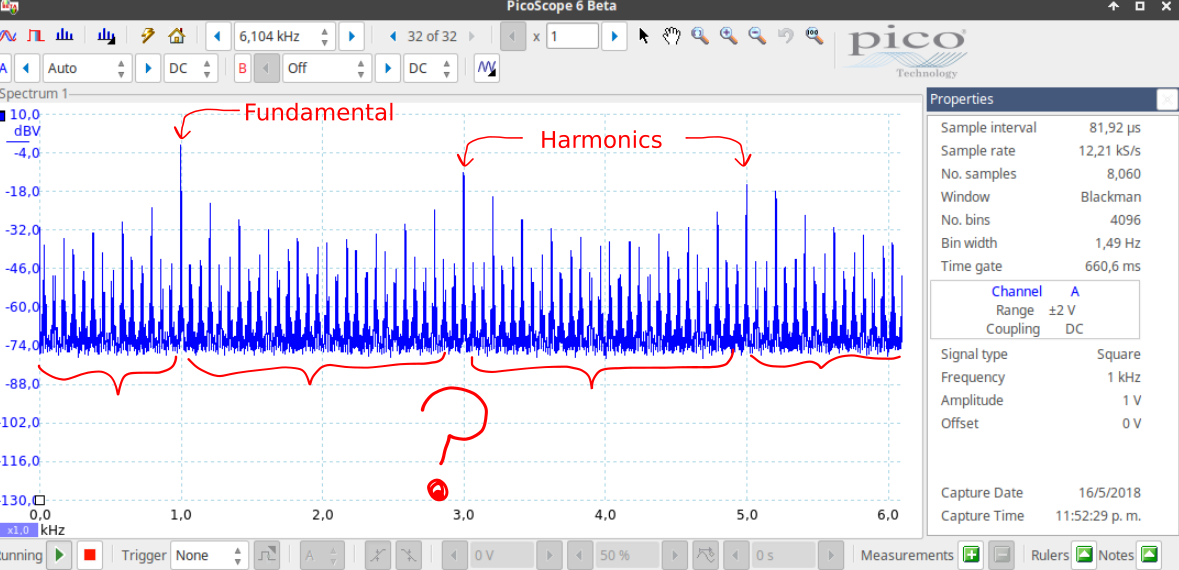
I get this spectrum:

enter image description here

EDIT 2:

Following the guidelines in the answer of Ali Chen I have verified that all those "strange peaks" are due to aliasing, just sweeping the frequency and watching how the spectrum moved. I had prepared a gif but cannot find how to embed it here. So I left a link to the gif.

\$\endgroup\$
4
  • \$\begingroup\$ You seriously need to watch: Fourier Transform by 3blue1brown. Stunningly good. And I think you will understand better. \$\endgroup\$
    – jonk
    Commented May 17, 2018 at 3:47
  • \$\begingroup\$ One thing is a perfect sine, continuous from -infinity to + infinity. Another thing is sampling a signal (that may have spurious noise frequency added, but that's not the crucial point) at intervals deltat between tstart and tend. Even in the continuous realm, the Fourier transform of a sine times a rectangle is different from the Fourier transform of a perfect sine. \$\endgroup\$ Commented May 17, 2018 at 5:23
  • \$\begingroup\$ See if this can be of help: download.ni.com/evaluation/pxi/… \$\endgroup\$ Commented May 17, 2018 at 5:29
  • \$\begingroup\$ Intermodulation and aliasing. \$\endgroup\$
    – user16324
    Commented May 17, 2018 at 10:43

3 Answers 3

7
\$\begingroup\$

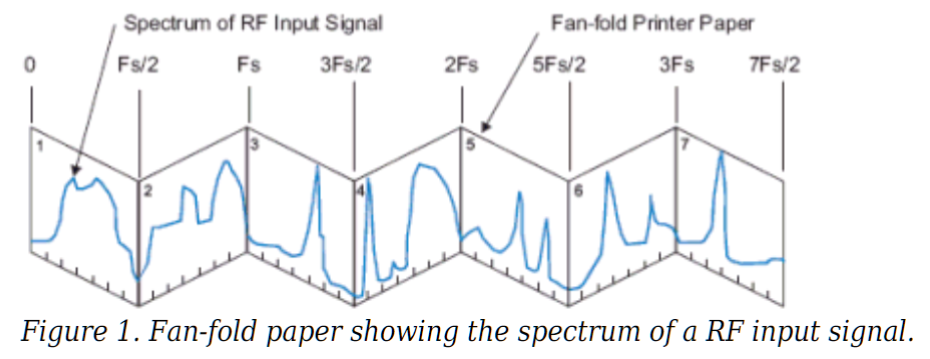
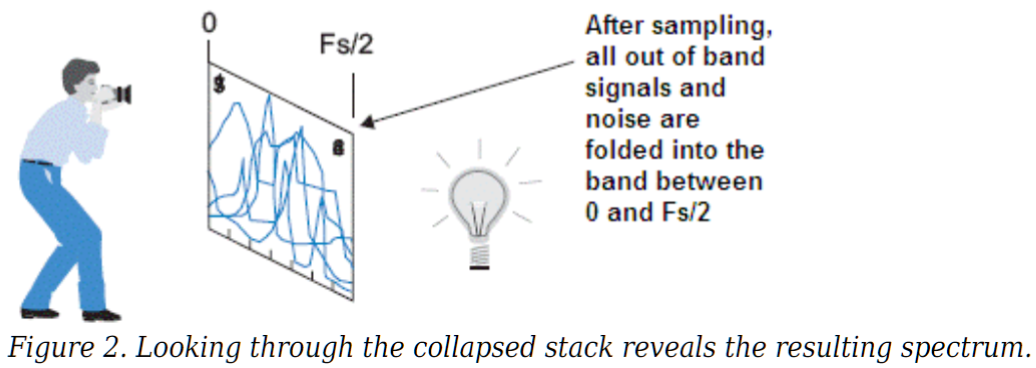
The multitude of spurious frequencies in your FF transform are reflections of undersampled higher harmonics of your signal. These are aliases, as you rightfully noted. See this EDN article for better explanations.

You are not using any cut-off filters on your signal, so all harmonics above the Nyquist frequency are "folded" back into the main frequency window. If you slightly move your main frequency, you will see that some peaks will move left, some move right, since they are coming from different folds.

enter image description here

enter image description here

\$\endgroup\$
4
  • \$\begingroup\$ "You are not using any cut-off filters on your signal", how can you tell? \$\endgroup\$ Commented May 17, 2018 at 5:08
  • \$\begingroup\$ @HarrySvensson, How can I tell? By the undistorted shape of rectangular wave, and by huge amount of aliased peaks. \$\endgroup\$ Commented May 17, 2018 at 6:20
  • \$\begingroup\$ Ah, clever. I forgot about the infinite series for the rectangular wave. \$\endgroup\$ Commented May 17, 2018 at 6:22
  • \$\begingroup\$ Interesting. I often wondered why I sometimes see peaks moving in the "wrong" direction on my SDR waterfall graph, now I know, thanks :). \$\endgroup\$
    – user98663
    Commented May 17, 2018 at 9:52
2
\$\begingroup\$

The peak above the red line is clearly the 30 kHz sine signal but, what are all those peaks below the red line? They are clearly not harmonics of my signal... There are peaks even at frequencies below the fundamental... Might this be caused by aliasing?

Here's your so-called "sinusoidal signal": -

enter image description here

Does that look "very" sinusoidal to anyone?

All those little artefacts will produce harmonics in the spectrum and those harmonics that are above the nyquist sampling rate will be pushed down into the base-band and may be seen as spectral lines below your "sine wave" fundamental frequency.

\$\endgroup\$
0
\$\begingroup\$

I see 30/60/90 KHz.

I see 15, 45, 75 KHz.

I see baseband trash, at dc - 4KHz, with 10 spectral lines of spacing 500Hertz, that get modulated at -65dB down, probably as Amplitude Modulation or Frequency Modulation (phase noise or jitter)

What is the source of your signal?

\$\endgroup\$

Your Answer

By clicking “Post Your Answer”, you agree to our terms of service and acknowledge you have read our privacy policy.

Not the answer you're looking for? Browse other questions tagged or ask your own question.