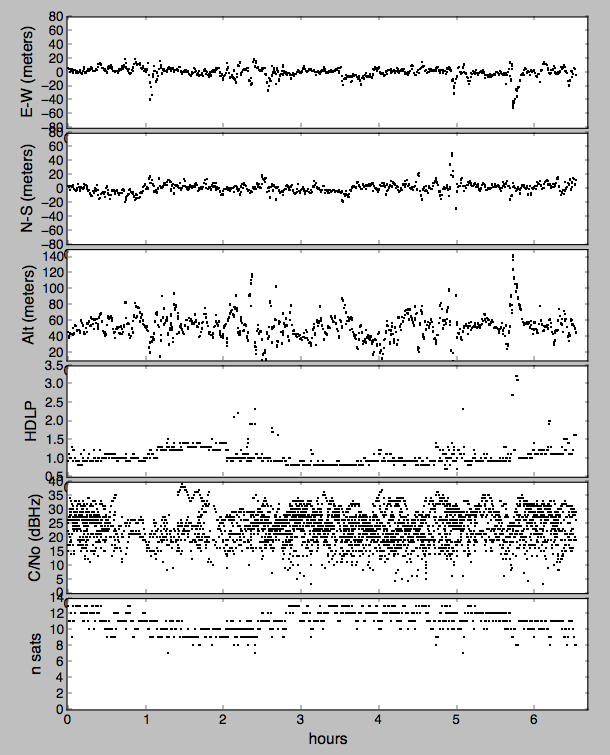
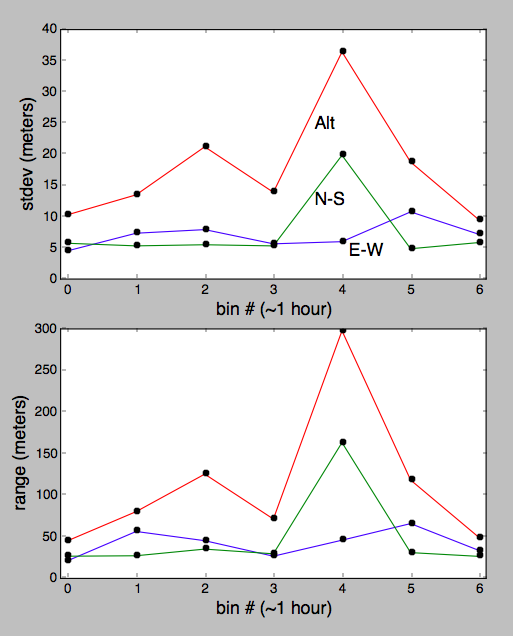
Below is data from a 6.5 hour run collecting NMEA sentences from a u-BLOX NEO-6 GPS module (datasheet, protocol spec) with an active external antenna via Raspberry Pi.
This is my first analysis to see if there is any way to detect poor antenna placement from the data, and flag a user if so. Here the antenna was placed very poorly, almost a worst-case situation with narrow sky view and strong reflections from between a pair of metal walls.
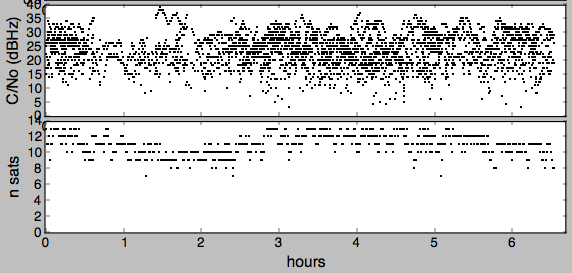
Every 30 seconds I collected 3 seconds of serial data, parsed $GNGGA sentences for lat, lon, alt, HDOP, and n_sats, and $GPGSV for C/No (dBHz) and alt/az of satellites used for solutions (alt/az not analyzed yet). If I understand correctly the presence of an SNR value for a given satellite in a given sentence (rather than a blank) indicates the satellite was used for a recent solution.
For GPS coordinates, each dot in the first plot represents results from one sentence, since multiple sentence appeared in the 3 second sample window, I've just plotted all of them as a first-pass analysis.
Question: What strategies might I try myself for a "poor reception" scheme? Examples might be:
- too many HDOP's greater than X in a Y-minute interval
- too many low C/No (dBHz) satellites used in solutions Sect. 7.4 (just asked What exactly does C/No (dBHz) mean in u-Blox GPS data?)
- too many satellites with high altitudes (elevations) are not being used in solutions
If it's necessary, I can calculate the positions of the satellites independently, but it seems that should simply agree with the ephemeris data in the module and $GPGSV sentences.
note 1: I'm not asking about reporting an accuracy, that's addressed in the following question.
- Inaccuracy in the GPS data
- How to calculate gps accuracy in meters from nmea sentence information
- How can I convert Horizontal dilution of position to a radius of 68% confidence?
- How correct is the “Accuracy” value given by GPS devices?
- Calculating absolute precision confidence number from Dilution of Precision indicators from GPS receiver
note 2: E-W and N-S coordinates are relative to median value of all data, Alt is absolute.


