0
\$\begingroup\$

I would like to know how to calculate the output power of a multi-MPPT solar inverter. As an example, I have chosen the Fronius Primo 8.2-1 inverter.

This inverter has 2 MPP trackers. For what I understand, this means you can have one string of PV modules connected to each of the trackers and have both strings operate at different optimal current+voltage points.

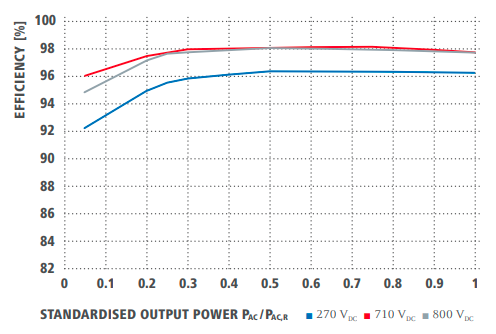
Now, the datasheet shows some operating efficiency curves:

enter image description here

If I have these operating points in each of the MPPTs (completely made up):

  1. 710 V and 8 A
  2. 270 V and 6 A

Let us assume the temperature does not affect the inverter's efficiency.

How do I calculate the output power?

  • Do I need to calculate the DC power of the MPPT input (i.e.: 710 * 8 = 5680 VA) and then multiply it by the efficiency given the MPPT voltage? If so, which output power should I use to get the efficiency point from the curve?
  • Internally, how does the multi-MPPT inverter work and how does it differentiate from 2 separated inverters?
\$\endgroup\$
3
  • \$\begingroup\$ 1) Yes. Divide your 8A by the Max Input Current to determine where you are on the efficiency curve. 2) As these are grid tie inverters, one can imagine the output side (sine gen, waveform shaping, protection and anti-islanding) and control/monitoring interfaces) are shared between both inverters, saving money. \$\endgroup\$
    – user16324
    Commented Jun 3, 2020 at 19:52
  • \$\begingroup\$ @BrianDrummond Why is the x-axis in the performance curve labelled as P_ac? That led me to think that would be related to the AC (output) power. In fact, it says "Standardized output power". \$\endgroup\$
    – Peque
    Commented Jun 3, 2020 at 21:19
  • \$\begingroup\$ @BrianDrummond Other inverters, like the SMA Sunny Boy also seem to display an output power efficiency curve. Which I still struggle to relate to the input voltage and power of a single MPPT when in a dual-MPPT configuration. \$\endgroup\$
    – Peque
    Commented Jun 3, 2020 at 21:24

1 Answer 1

3
+50
\$\begingroup\$

Manufacturers datasheets are for promoting sales and therefore normally show the best-case scenarios.

My guess would be that these efficiencies are measured utilizing only 1 of the 2 MPPTs. You should consider additional losses in the case of using two MPPTs.

Just as a side note: You are interested in a single operational point which may be valid when you have clear skys, an ambient temperature of 20ºC and the suns angle provides an incident radiation of 800W/m2 on the panels. PV Panel Characteristics change with temperature, age, radiation amoung other factors.

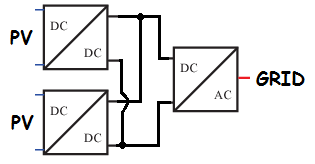
There are many arquitectures out there. But in Multi/Poly MPPTs usually you have - a DC/DC converter stage and - a DC/AC Inverter stage.

Just a couple configuration examples:
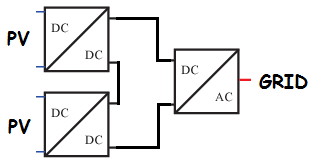
Series DC/DC Parallel DC/DC

There are others, but just to give a couple examples..

  1. You have a DC/DC boost/buck stage for each MPPT a. This regulates each MPPT PV input voltage to make the common DC bus voltage (Input to Inverter Stage)
  2. then a DC/AC Inverter stage. a. depending on the Grid Impedance, AC output voltage, the phase angle (amount of reactive power), amoung others, the optimal DC BUS voltage for the inverter will differ. In the case of cos phi = 1 and 230 Vac, typically you will want something like 230*sqrt(2)+15V margin. But that will depend on the architecture and the losses which have been classified for each stage. perhaps there are greater losses operating the DC/DC stage at one voltage compared to the AC/DC operating at another and the inverter may adjust to its calibrated/configured optimal operating points.

Other Configurations

Some inverters with two stages may have:

  • 1st Stage (DC/DC): Buck-Bosst to regulate to a common DC Buss voltage for the second (DC/AC) AC output Stage, as described above.

    • In the case of multi-mppts you can see that each MPPT just operates at each Strings MPP and converts it to the desired/defined common DC-Bus Voltage.
  • 1st Stage (DC/DC): Only Boost and the 2nd Stage (DC/AC) will be a kind of "Buck" / "Direct MPPT".

    • If it can operate at the mpp point being at a voltage above the minimum required to inject current into the grid (see note below) the boost will not be needed in the case of a single String.

      • Extending this to multi mppt, the 2nd Stage (AC/DC) will work at the higher voltage MPP of the several inputs and have the lower MPPs boosted from their specific MPP Voltages to that voltage of the higher MPP.

note : to have current flow from the inverter to the grid you need to a higher voltage than the grid and you can say approximately ((PWM rms voltage generated by inverter)-Grid Voltage)/(filter + Grid Impedance @ specific phase angle) = Current injected into the grid.

On top of that, perhaps the specific architecture is not compatible with such a big difference as you propose (800/270) between the independent MPPTs.

As you see it is not simple to give a precise general answer to this.

Quick Estimate:

As a quick guesstimate of efficiency, if that configuration were possible, I would do a weighted average:

710*8 = 5680 * (5680/8200 -> 0.69 Pr point --> 98% efficiency)

270*6 = 1620 * (1620/8200 -> 0.2 Pr point --> 95% efficiency)

Efficiency guesstimate would be the weighted average = (5680*.98+1620*.95)/(5680+1620) ~ 97% efficiency

There will be more losses, so I would consider this as a maximum obtainable efficiency.

Again, I am not sure your suggested case scenario is a stable operating point of the inverter, I have a feeling that there is too big of a voltage difference between the two MPPT operational power points.

More Precise Estimate:

There is a popular PV Simulation software called PVSyst which has been since a while the industry goto package for simulation solar installations. This software simulates in great detail the different aspects of a PV Installation. The manufacturers develop simulation models for their components, be it PV Panel, Inverters, etc..

The inverter models are .OND files which the software takes as input to model the inverter. For Fronius specifically you can find their PVSyst Files Here . At this moment I get a ERR_CONNECTION_RESET response from the download links but an email to Fronius should be sufficient to get these files

Fronius has a Quick Guide on using PVSyst with some other model.

Creating your own Empirical Model of the inverter

There is a SANDIA REPORT, specifically , Performance Model for Grid-Connected Photovoltaic Inverters - SAND2007-5036 which proposes an empirical fit to model inverters from field measurements performed. You could fit data provided by the datasheets to calculate this model.

Although this is not for a multi-mppt inverter it may provide another approach to estimate efficiencies.

\$\endgroup\$
8
  • \$\begingroup\$ Thanks for your detailed answer! ^^ Do you have any idea on how does PVSyst calculate this? Since the .OND files do not provide more information than the datasheet (i.e.: they have the same efficiency curves that I uploaded as an image in the question). So they must be solving this problem with the same (limited) information I currently have. \$\endgroup\$
    – Peque
    Commented Jun 9, 2020 at 8:51
  • \$\begingroup\$ Hi Peque, I don't know how the .OND files are used by the software. I used to work in a company where I got to see the development of the internals to generate the OND file. For that specific inverter it was complex network of "LabView Style" Blocks with inputs you would expect such as temperature, voltages, currents, phase angles, etc... with conditional paths and applied coefficients depending on those inputs to define an output. I've checked the specifications of those OND files now and am surprised to see that it specifies what you state. I'll investigate further when I find the time. \$\endgroup\$ Commented Jun 11, 2020 at 6:17
  • \$\begingroup\$ I just opened an old OND file I have from back then and have a mixed ascii/binary encoded file contents. The file has around 2KBytes of data which I would expect to have more information than just efficiency curves. I even have different OND files for different firmware versions of the inverter, which makes me think that it contains more info than just efficiencies, although yes, efficiency could change with different FW versions. Perhaps PVSyst has a simple mode where it just takes efficiency as arguments to perform its calculations and an extended mode which can work more in detail. \$\endgroup\$ Commented Jun 11, 2020 at 6:48
  • \$\begingroup\$ Thanks a lot for your insights. I wish I knew how a reputable PV simulation tool solves this problem! ^^ \$\endgroup\$
    – Peque
    Commented Jun 11, 2020 at 7:27
  • \$\begingroup\$ In my old PV folders, I found an old paper describing a modeling of inverters which provides an empirical model generation of unknown inverters, I even found it online (it's still hosted) Performance Model for Grid-Connected Photovoltaic Inverters - SAND2007-5036 I will update the answer to present it and include it as another alternative. It will be usefull for you especially in simulating points which are not defined in the datasheets. \$\endgroup\$ Commented Jun 11, 2020 at 7:33

Your Answer

By clicking “Post Your Answer”, you agree to our terms of service and acknowledge you have read our privacy policy.

Not the answer you're looking for? Browse other questions tagged or ask your own question.