3
\$\begingroup\$

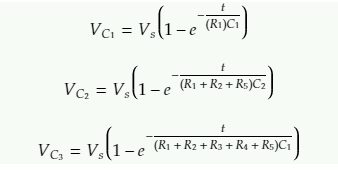
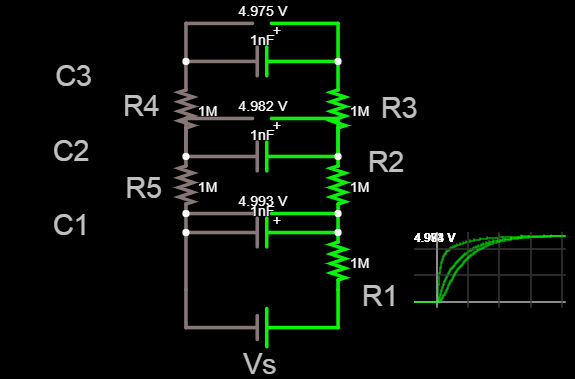
I wanted to mathematically find the voltage on all capacitors in a Marx generator circuit. I thought that each capacitor would be charged like its own RC charging circuit. I came up with these formulas for this 3 stage charging Marx generator circuit enter image description here

enter image description here

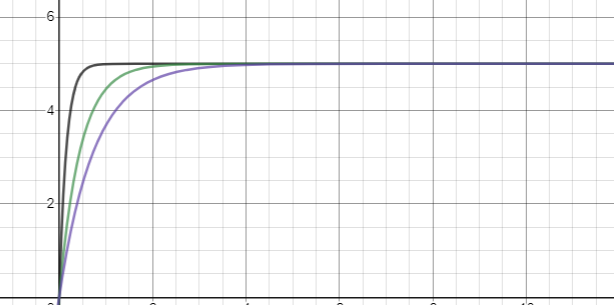
But the graph of my equations (shown below) does not match the simulation (show above). (Note that I couldn't get the sec/div to match that of the simulation, so one may looked stretched out more). That note considered though, when I added more capacitors to the Marx generator, my equations got even less accurate. enter image description here

I need help finding the equations representing the voltage across the capacitors in a Marx generator. Thanks!

\$\endgroup\$
2
  • \$\begingroup\$ Unfortunately the correct result is much more complicated than just getting 3 independent time constants. You can't ignore the other parts of the circuit when doing your calculations. The correct answer is very messy. \$\endgroup\$ Commented Sep 10, 2020 at 2:27
  • \$\begingroup\$ Your circuit is of 3rd-order and you can use the fast analytical circuits techniques or FACTs to quickly determine the symbolic expression. Depending where you probe the voltage, all 3 expressions will share a common denominator but numerators will differ. Then determine the time-domain response with a \$\frac{1}{s}\$ stimulus driving the transfer functions. \$\endgroup\$ Commented Sep 10, 2020 at 7:08

2 Answers 2

3
\$\begingroup\$

I never heard of these Marx generators but the concept is extremely clever indeed. To determine the voltage across the various capacitors in the time domain, I will determine the transfer function (TF) linking the input voltage (the stimulus) to the various responses collected across \$C_1\$, \$C_2\$ and \$C_3\$.

There are two options to get there: the brute-force approach and the fast analytical circuits techniques or FACTs described in my book. The original circuit will be rearranged to simplify the analysis. The below picture confirms by simulation that all waveforms are identical:
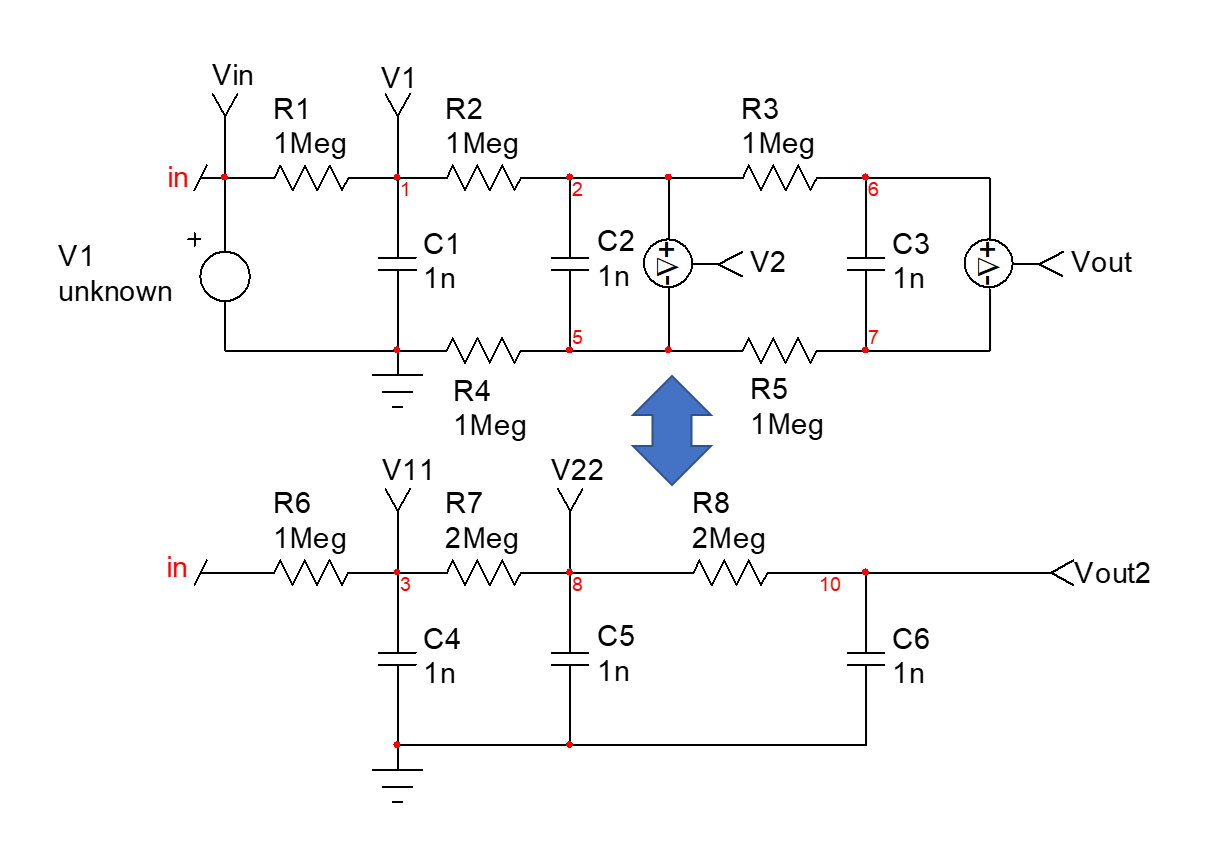
enter image description here

Starting with the first TF determined with a response collected across \$C_1\$, you can see a network in series with \$R_2\$ and loading \$C_1\$:

enter image description here

The brute-force approach will determine the TF using an impedance divider. The formula looks compact but good luck to format it in a low-entropy form.

Ok, to apply the FACTs to these cascaded \$RC\$ networks, we first look at the circuit in dc (\$s=0\$, open the capacitors) and determine the gain which is 1. Then, zero the stimulus (replace the \$V_{in}\$ source by a short circuit) and determine the times constants in various conditions as depicted below:
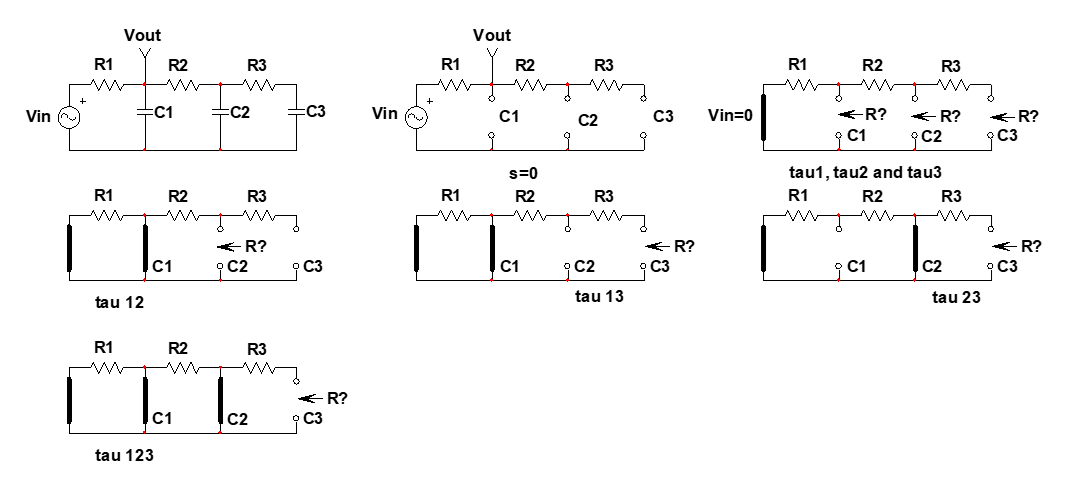
enter image description here

No need for complicated KVL or KCl equations, inspection is the way to go here. Then, for the zeroes, you consider the network loading capacitor \$C_1\$. When this transformed network creates a transformed short circuit, the response is nulled. Finding the numerator of this expression will lead us to our zeroes. Fortunately, zeroing the response across an impedance you want to determine consist of replacing the current source by a short circuit, simplifying the time constants determination:
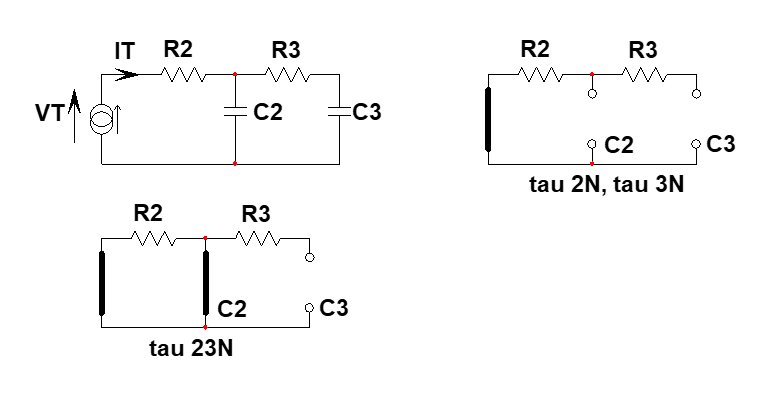
enter image description here

When this is done, you can start assembling the various transfer functions noting that:

  1. the denominator is common to all transfer functions
  2. probing across \$C_1\$ reveals two zeros
  3. probing across \$C_2\$ reveals a single zero located at \$\omega_{z2}=\frac{1}{R_3C_3}\$
  4. probing across \$C_3\$ shows no zero at all

The Mathcad sheet is here:

enter image description here enter image description here

Finally, we can test the various responses after approximating the 3rd-order polynomial into a single pole cascaded with a second-order equation:
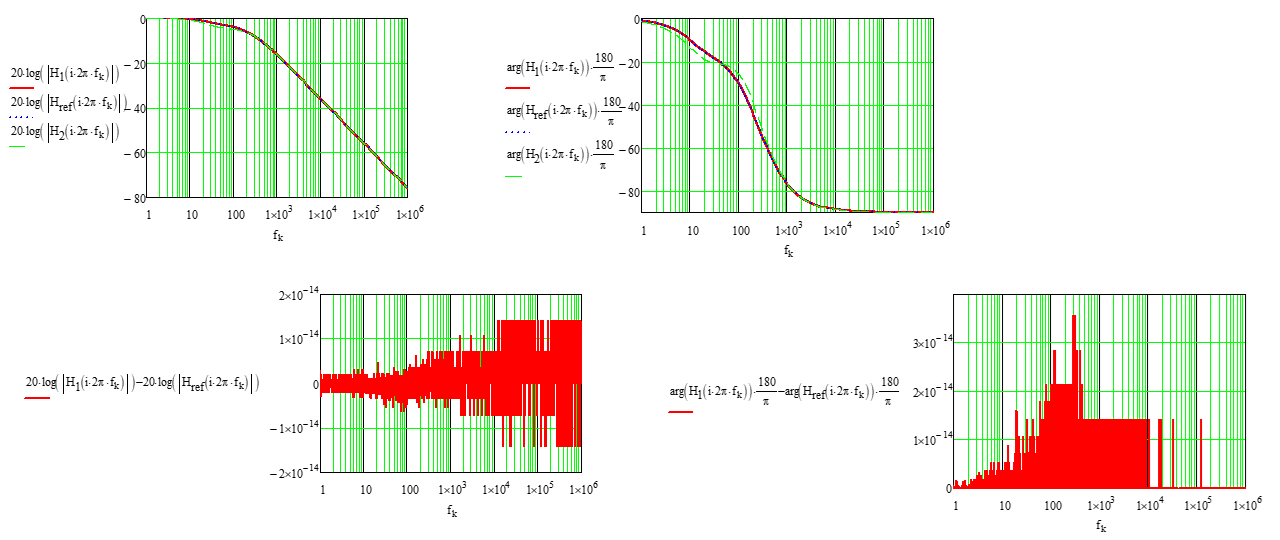
enter image description here

Now that we have the TFs ok, we can look at the time-domain response. Unfortunately, for unknown reason, Mathcad does not manage units well when doing this exercise. I have created a new page without units. Multiply the Laplace TF by a step \$\frac{1}{s}\$ and ask for the inverse Laplace transform:

enter image description here

The solver delivers the plots in a few seconds:
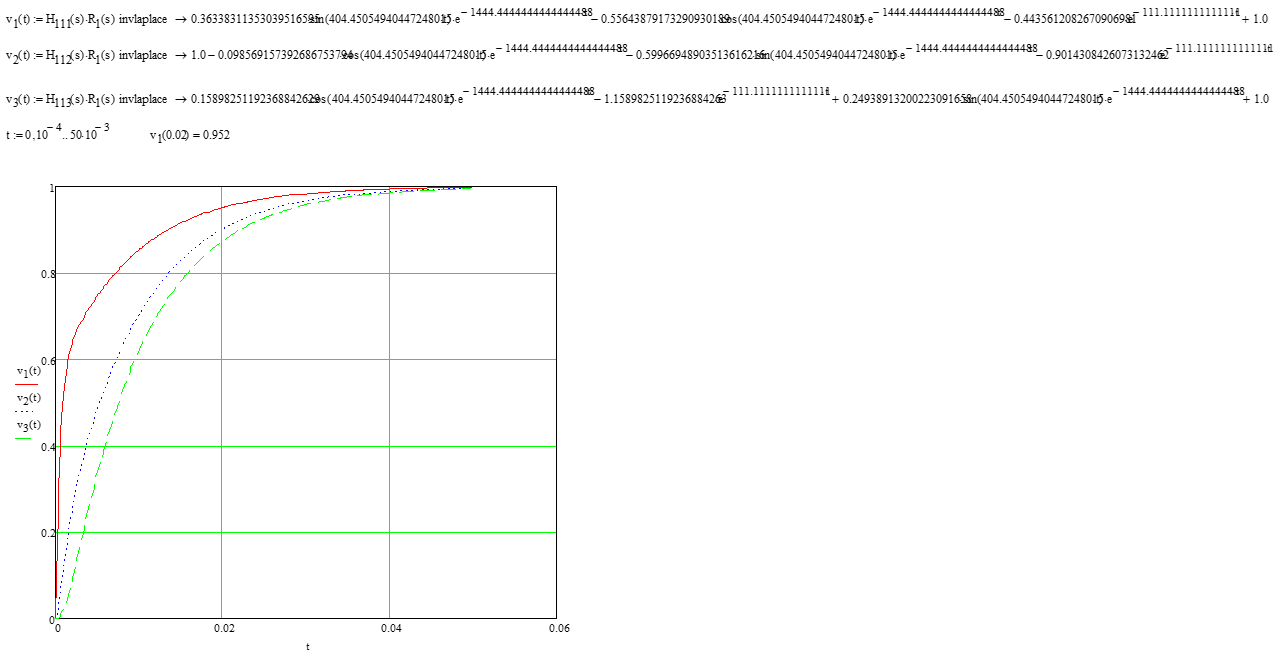
enter image description here

The FACTs have lead me to the answer in a quick way by dividing this complicated circuit in small pieces that I individually solved. If I made a mistake, I can go back to the guilty sketch and fix it without restarting from scratch.
\$\endgroup\$
2
  • \$\begingroup\$ Okay, I finally tried the differential equation transient analysis on a 2-stage charging Marx generator circuit and came up with a second order differential equation. From this I can see it's impractical to use this method of analyzing capacitor voltages in Marx generators which often have many more stages than 2 or 3 (often 7-15 could be practical), but it sure is fun. Thank you for your very helpful and inspiring answer. I can see that you put a lot of effort and thought into your answer and I really appreciate it. Thank you! \$\endgroup\$ Commented Sep 24, 2020 at 14:17
  • \$\begingroup\$ No problem, it's always a pleasure to exercise FACTs : ) \$\endgroup\$ Commented Sep 24, 2020 at 15:02
2
\$\begingroup\$

As per my comment, you can't assume that the capacitors are open circuits. Each cap acts as a short when presented with a high frequency. On the rising edge of the step C1 initially gets all of the current because R2+R5 is a large impedance in series with the rest of the circuit. C1 starts to charge up with the R1*C1 time constant. But as it charges it's impedance increases and it no longer gets 100% of the current. It forms a voltage divider with the other circuit elements. The other caps also act as low impedances initially until steady state is approached. This vastly complicates the transfer function. I had to use MATLAB to help me.

Take a look at the following picture:

enter image description here

V_C1 initially charges faster than V_C1_Test, but then as C1 becomes a larger impedance the voltage starts to slow down it's climb. You no longer have a nice pure 1-e^-t type of equation like you do for the V_C1_Test case. If it was the V_C1 voltage would either be strictly larger or smaller than V_C1_Test Voltage.


enter image description here

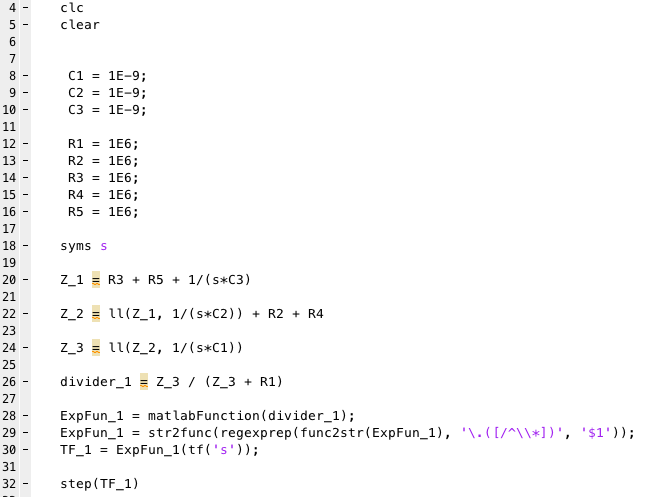
All I did in the MATLAB code above is find the total impedance and use voltage division to find the V_C1 voltage.

I made a function; 'll(x,y)' which returns x*y/(x+y). Kinda checky IMO.

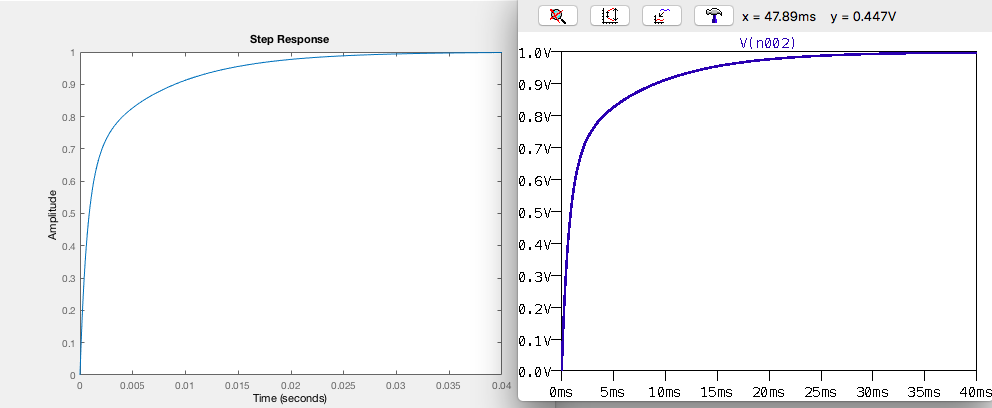
Below I compare the step response of my analytical answer with LTSpice Simulation. The left waveform is my MATLAB output for V_C1, the right waveform is my LTSpice output for V_C1 (I normalized the voltage to 1V). As far as I can tell they are identical.

enter image description here


For fun, here's the transfer function. Oh how far it is from 1st order! I also have a case where C3 = 100nF which emphasizes the changing response.

enter image description here

enter image description here

symbolic to TF code: https://www.mathworks.com/matlabcentral/answers/310042-how-to-convert-symbolic-expressions-to-transfer-functions

\$\endgroup\$

Your Answer

By clicking “Post Your Answer”, you agree to our terms of service and acknowledge you have read our privacy policy.

Not the answer you're looking for? Browse other questions tagged or ask your own question.