I hope it is okay to post a software question here. Please let me know if not.
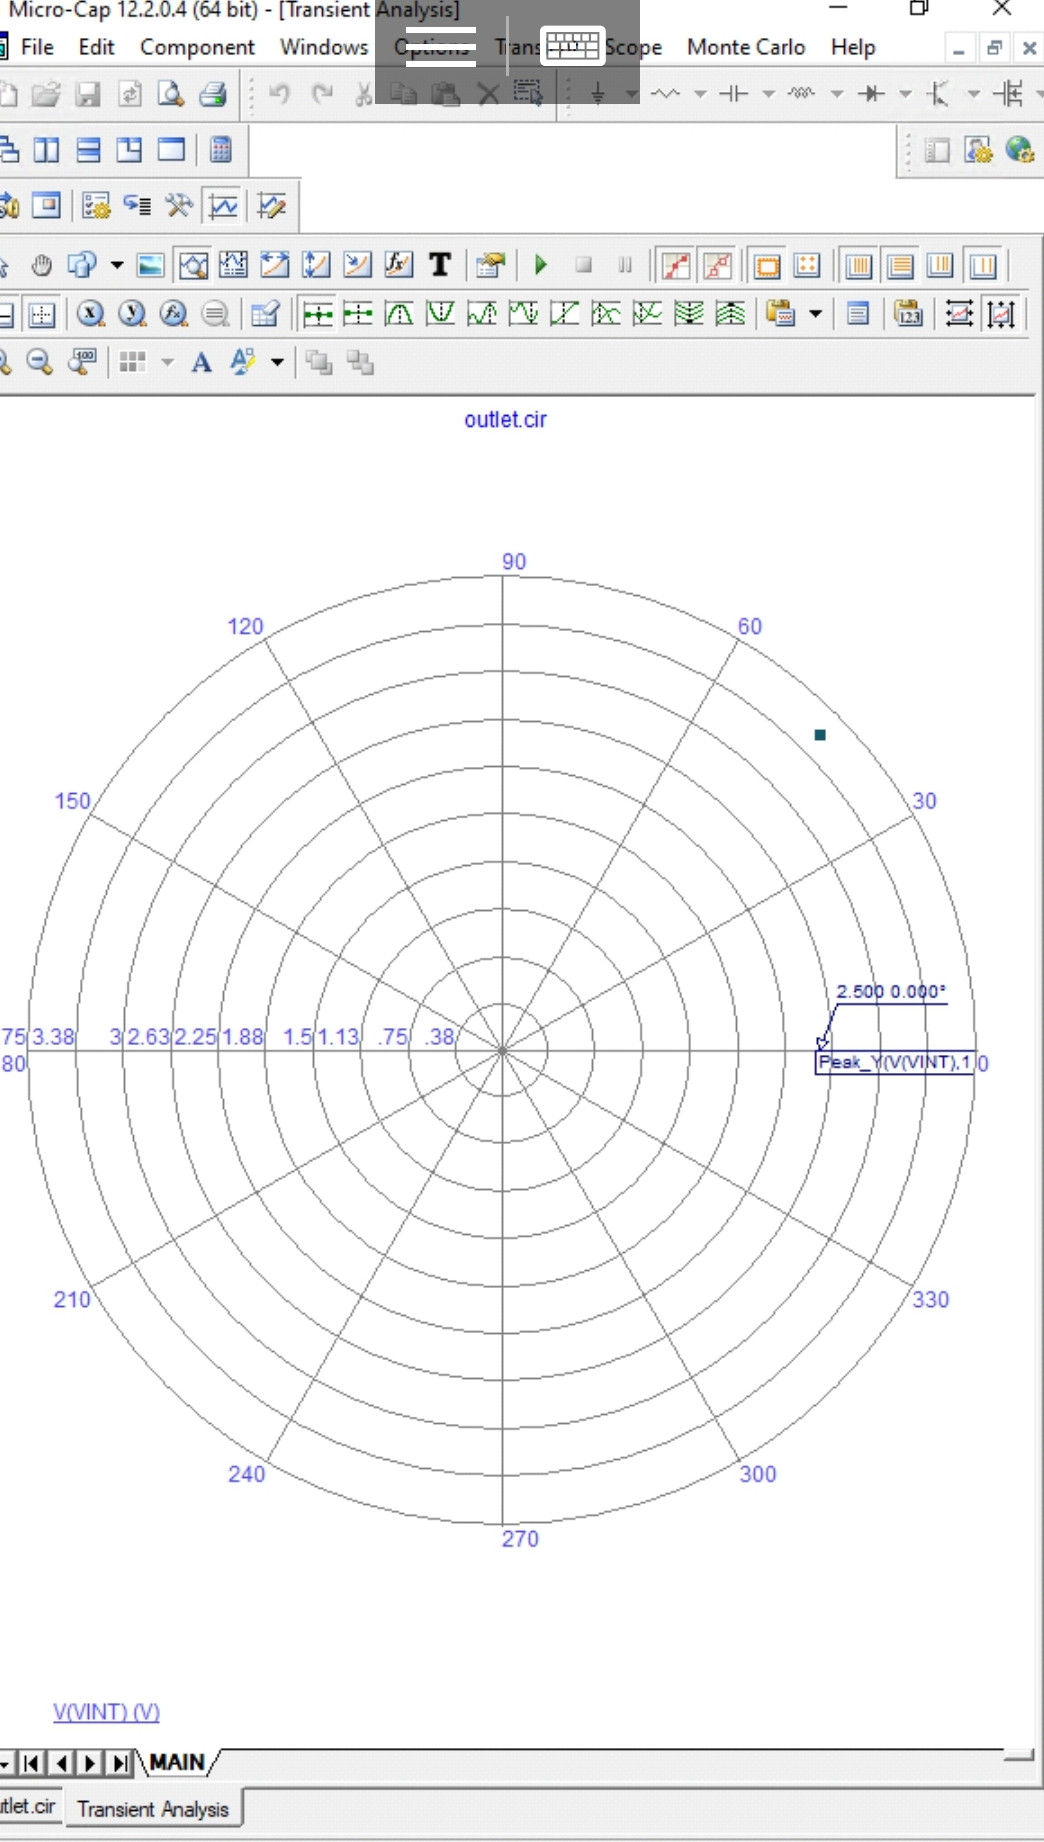
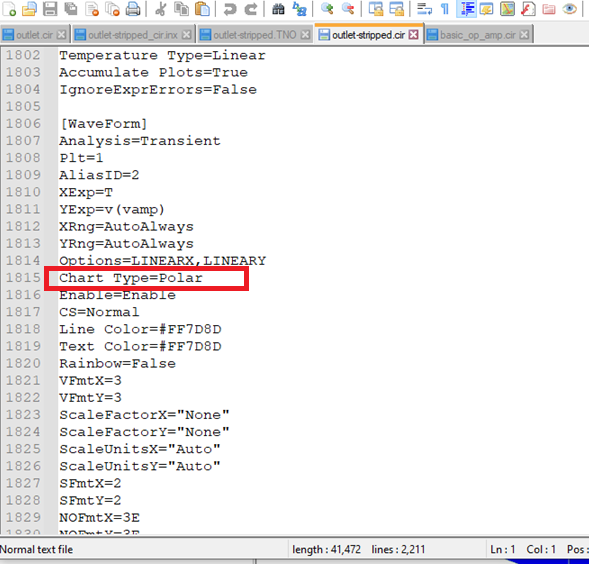
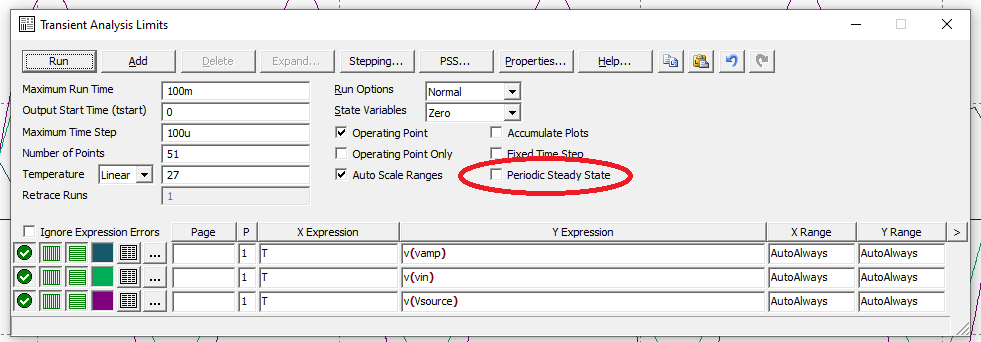
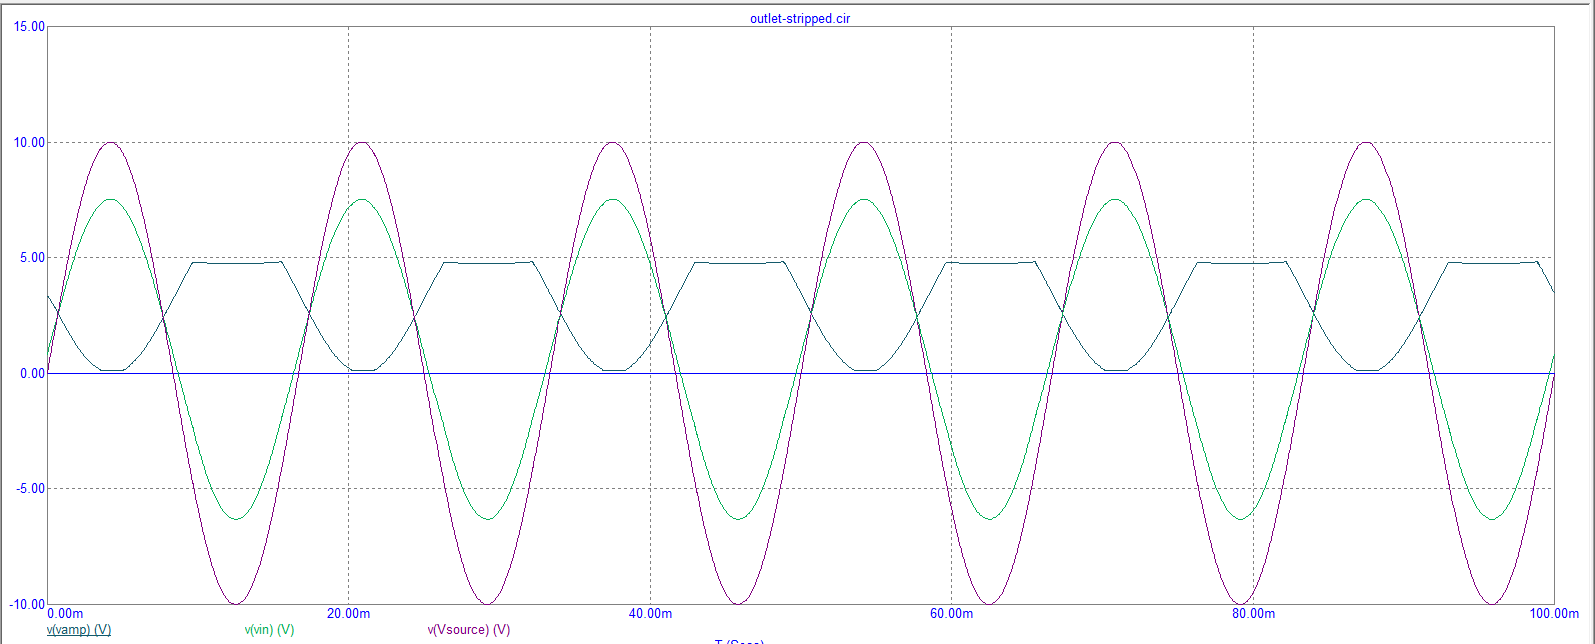
I've been learning about Microcap 12 (a SPICE simulator), and have been quite impressed. However, recently I got stuck. I am using a transient analysis, and the software for some reason is producing a polar output plot with complex values. It had been the regular rectangular one that most spice programs produce at first, but I did something, and now I can't get back to the rectangular output no matter what I've tried. I've tried changing almost every relevant setting I could find, but to no avail. I've looked in the user guide and on Spectrum's website, but can't find any fixes. They would seem to say that a polar plot isn't an option for a transient analysis, so I'm starting to suspect some configuration bit might have been advertently set in error.
Am I missing some setting somewhere?
Thanks for any help.


