1
\$\begingroup\$

enter image description here

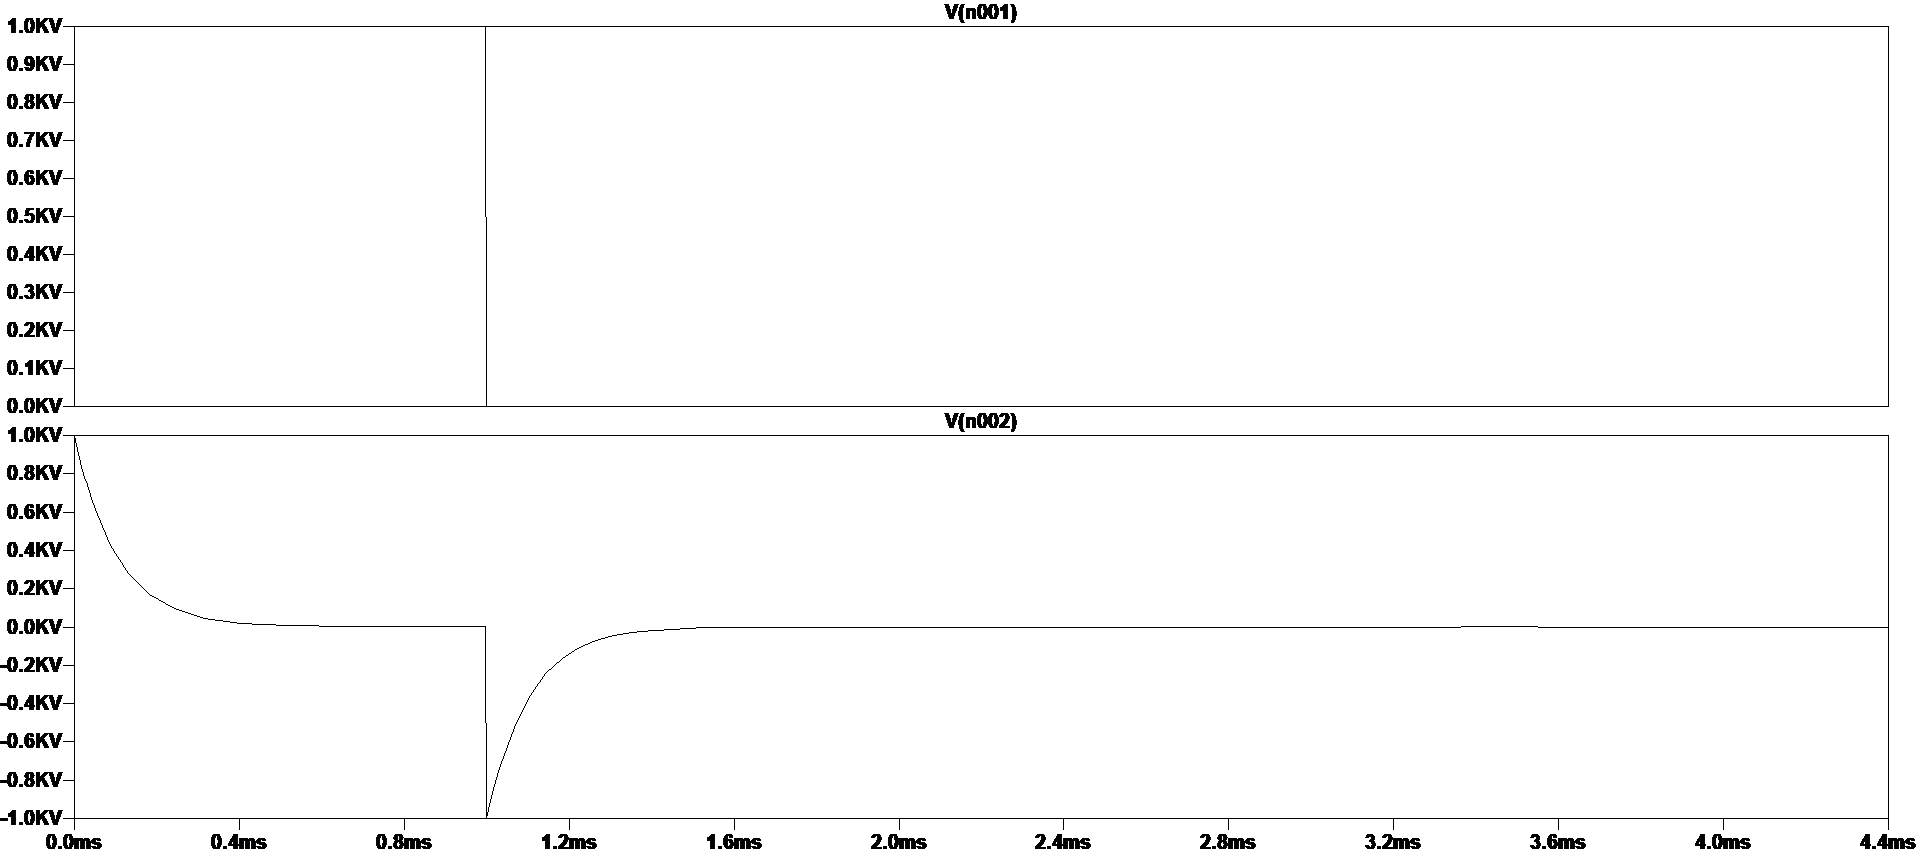
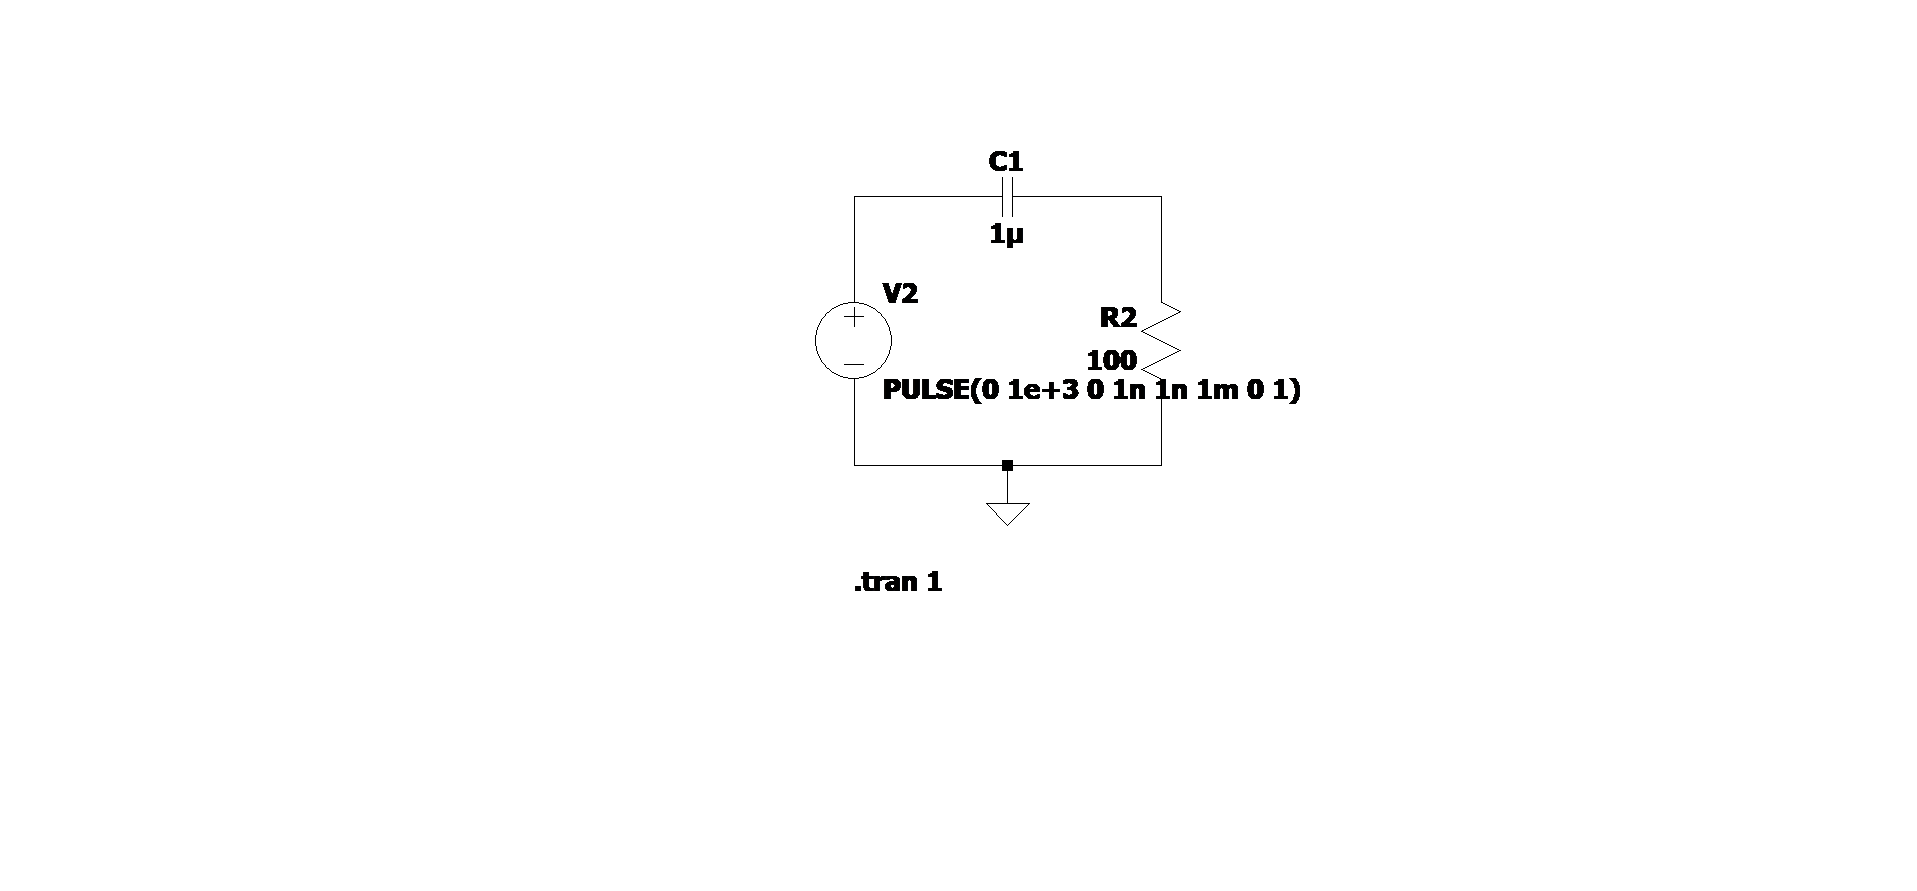
I have an assignment which requires me to find the impulse response of a high pass filter on LTspice. In order to do this the question suggest feeding a Dirac delta function as an input to a simple high pass filter circuit consisting of 100R resistor and 1uF Capacitor. Now I've tried a triangular pulse and square pulse with a high voltage and minimal rise and fall times but I don't quite get the expectedthe frequency response (the general frequency response of a high pass filter) when I take an FFT of the output voltage.

It would be brilliant if someone could show me the best way to approximate a Dirac delta function on LTspice. Any and all help is appreciated, thanks in advance.

High pass filter with simulation parameters for a square wave input:

enter image description here

enter image description here

\$\endgroup\$
7
  • \$\begingroup\$ Please mention the sampling frequency and other details of the fft. Have you taken fft of the input as well? Does it look like that of an impulse? Please add diagrams and waveforms you input and output. \$\endgroup\$
    – AJN
    Commented Dec 27, 2020 at 14:44
  • \$\begingroup\$ SPICE programs usually use variable sampling time. Have you resampled the waveforms to fixed sampling time? What software are you using to do the fft? \$\endgroup\$
    – AJN
    Commented Dec 27, 2020 at 14:45
  • \$\begingroup\$ Ive added some photos. Please have a look at the them by clicking on the numbers on the bottom. My apologies for the presentation its my first time posting here. \$\endgroup\$
    – alex dex
    Commented Dec 27, 2020 at 15:16
  • \$\begingroup\$ Forget it. Impulse response of a high pass system contains an impulse+some ringing or decaying or both. Infinite peak cannot be approximated. In DSP impulse is finite and that's different thing. But it's not in the comfort zone of LTspice. You can get the ringing and decaying part right if you apply a rectangular pulse one sample interval long and the amplitude in volts is 1/sample interval in seconds. \$\endgroup\$
    – user136077
    Commented Dec 27, 2020 at 15:26
  • 2
    \$\begingroup\$ As the step function is the integral of a dirac delta, how about applying a step (easy to generate), and then differentiating the response? \$\endgroup\$
    – Neil_UK
    Commented Dec 27, 2020 at 16:01

2 Answers 2

1
\$\begingroup\$

The amplitude spectrum of a square pulse input is a sinc-function, and these are the high-frequency lobes that you see in your FFT. Whatever you do, these lobes will always be there. If you make your input pulse too long, these lobes will get in the way of your signal. This basically means that your input signal should be short enough compared to the highest frequency that you wish to capture in your FFT.

The time you simulate will also play an important role on the frequency range of your spectrum. In order to capture down to \$1Hz\$ for example, you will need to simulate at least \$1s\$ of your impulse response.

An lastly, the number of points in your FFT are also important to avoid seeing those artifacts in your FFT. You mainly need to ensure that at least one sampled point is part of your input pulse, and if you make it higher than that you will start to see those lobes at higher frequencies.

The ideal combination would be: $$T_{stop} = 1/f_{min}$$ $$T_{width,input} = 0.5/f_{max}$$ $$N_{fft} = f_{max} / f_{min}$$

Here, \$T_{stop}\$ is the transient simulation time. \$T_{width,input}\$ is the pulse width of the input voltage source. \$N_{fft}\$ is the number of points to use for the FFT.

And finally, there's numerical errors that can also affect your impulse response. Go as strict as you're comfortable with.

For example:

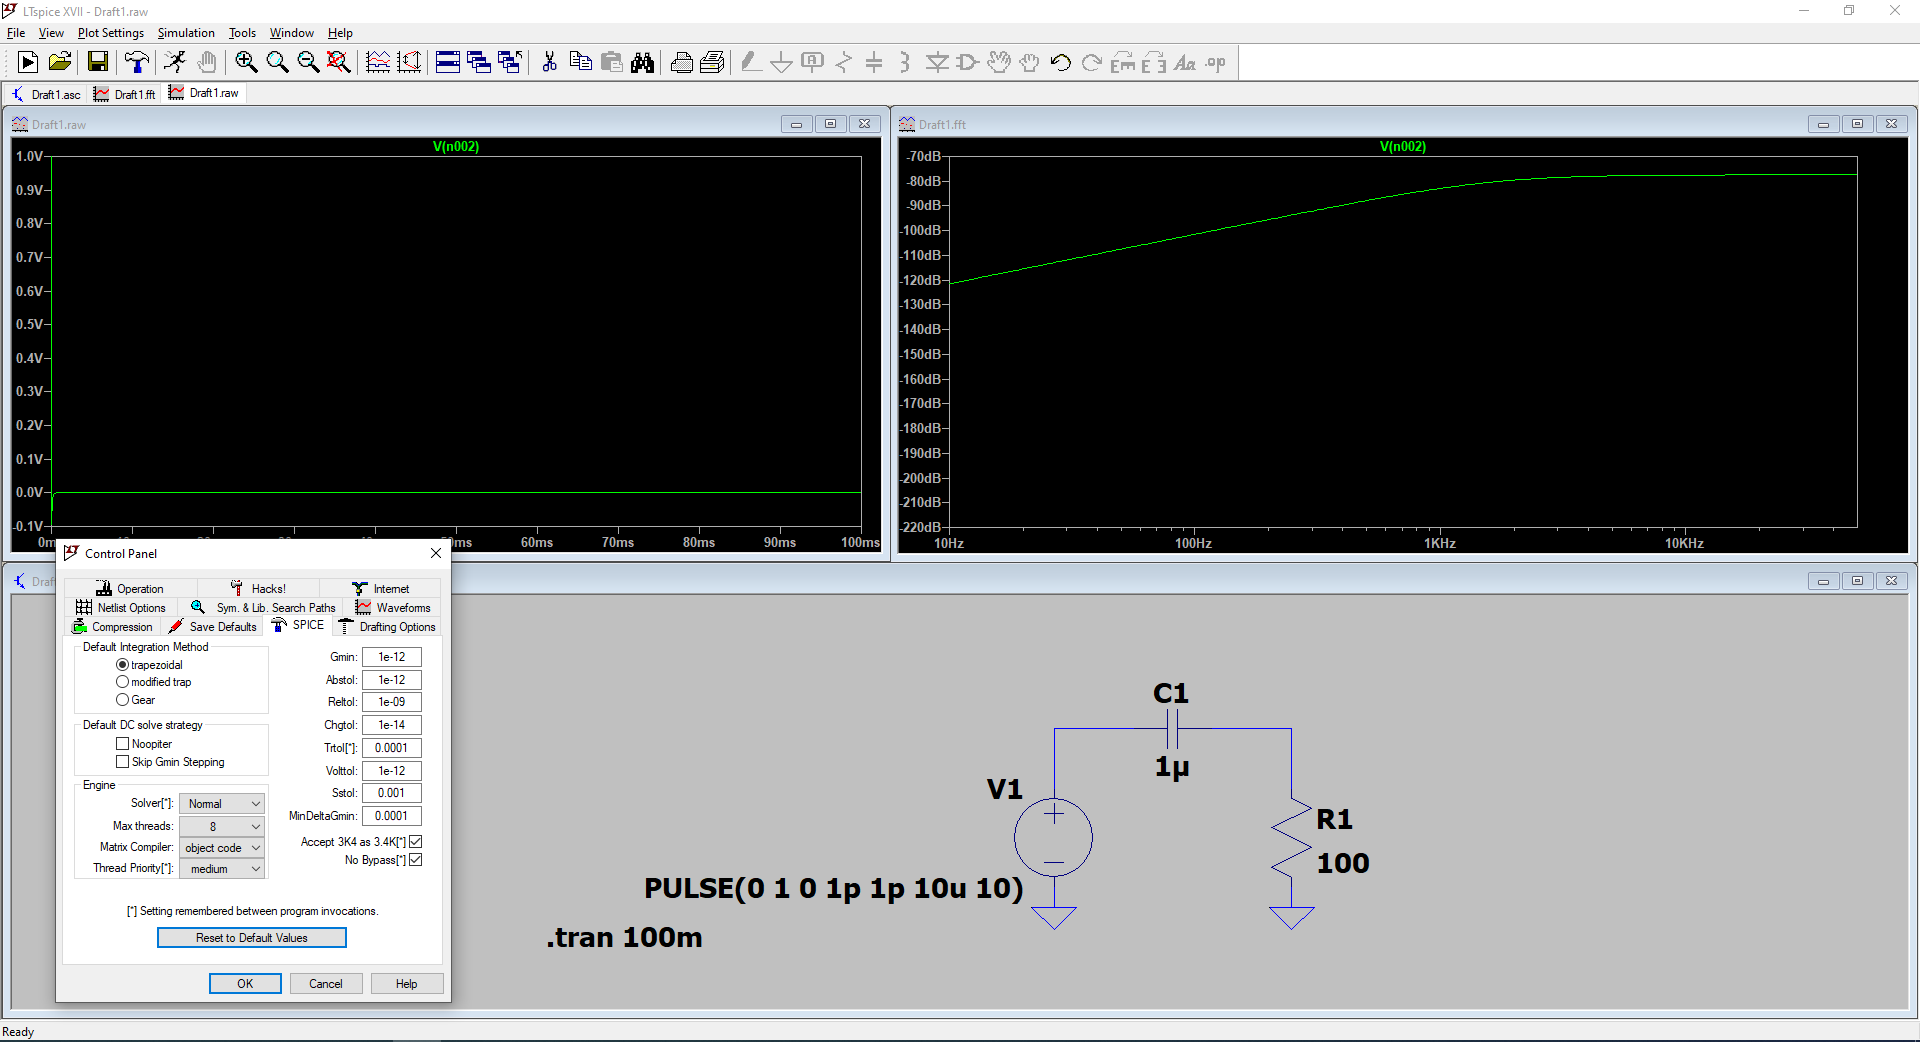
  1. Use an input pulse of \$10\mu s\$ wide and specify \$1ps\$ rise and fall times to ensure that the simulator also truncates the timestep (\$f_{max} = 50kHz\$).
  2. Simulate with a transient simulation from \$0\$ to \$100ms\$ to get an FFT down to \$10Hz\$ (\$f_{min} = 10Hz\$).
  3. Plot the FFT, but only use \$10\ 000\$ points instead of the default \$262\ 000+\$ points to avoid the high-frequency lobes. You can go higher, but keep in mind that these lobes are because of the non-0 pulse width of the input.

If you are unhappy with the results, make the tolerances stricter by going to the configuration under the tab "SPICE". For example:

  • Reltol = 1e-6 (this is the relative tolerance, default is 1e-3)
  • Trtol = 1e-4 (this is the truncation error tolerance factor, default is 1)

[EDIT] There are a few other things you might need to change.

  • LTSpice will smoothen out points by default, but this also messes with your FFT. If you take the FFT, make sure the binomial smoothing is set to 1 (3 is the default).
  • LTSpice uses a modified version of the trapezoidal method, leading to artifacts in the FFT. The regular trapezoidal method may give better results.
  • If you make the total integration time too big, then numerical errors may dominate.

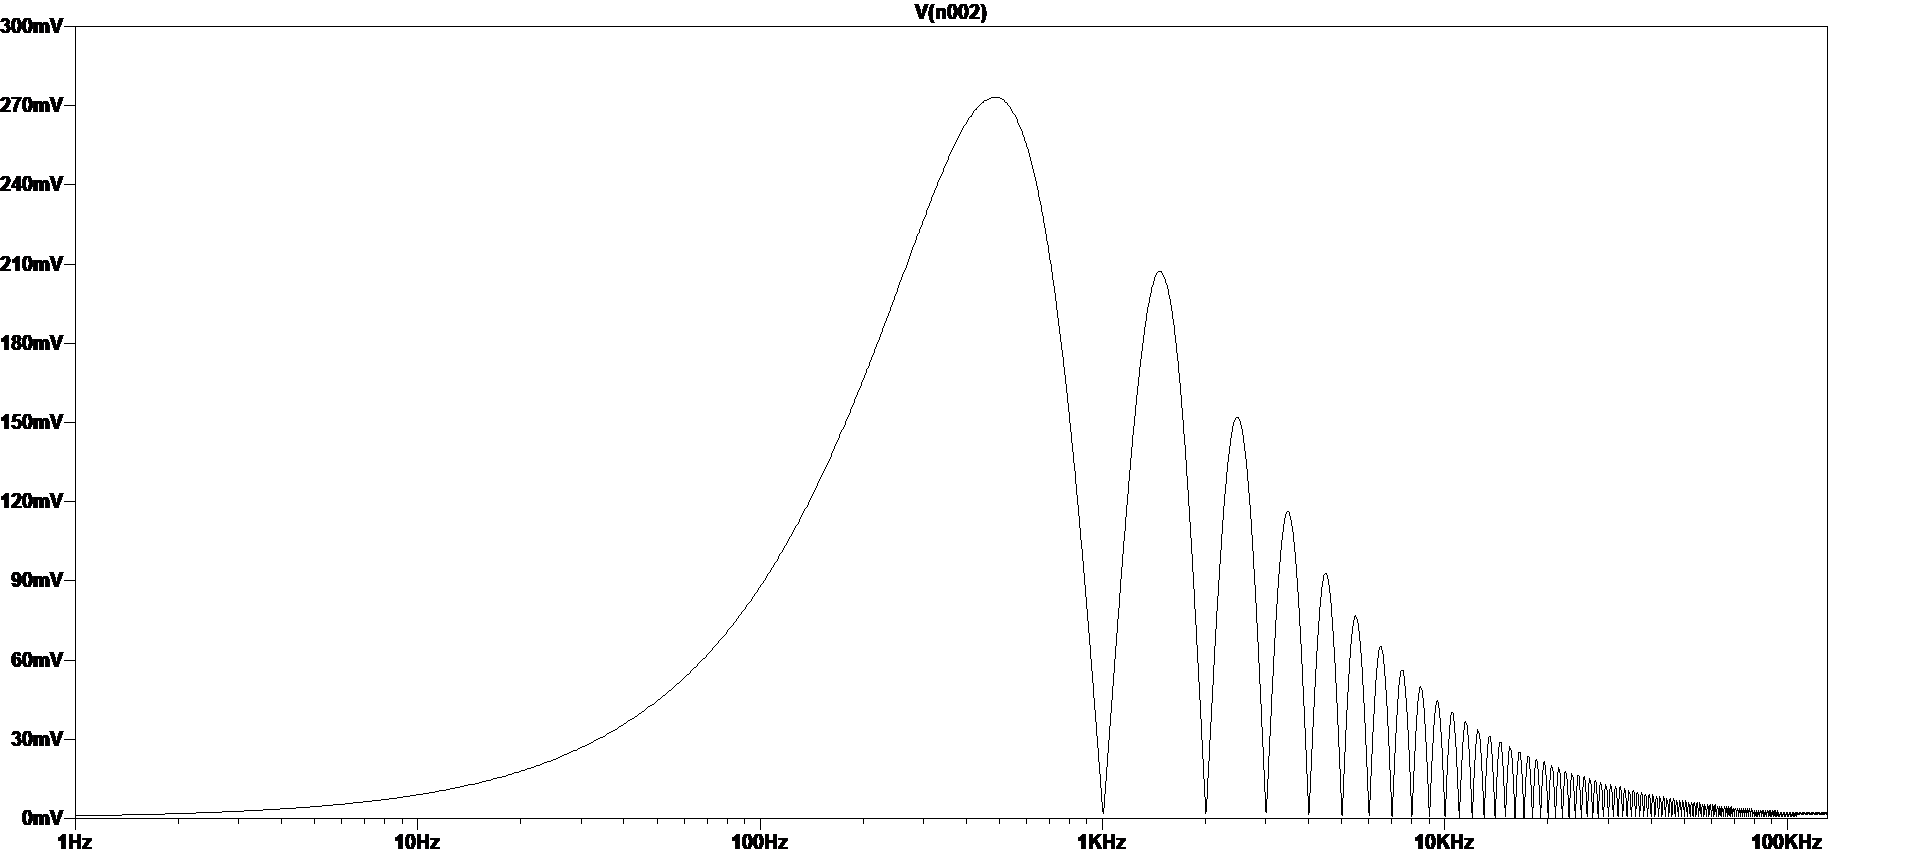
Here's a screenshot of my results (I didn't normalize the input pulse area though, but that's just a scaling factor):

Impulse Response to FFT

\$\endgroup\$
8
  • \$\begingroup\$ For some reason the simulation suddenly slows down around 10us mark when I use the simulation parameters you have suggested. Again the output voltage looks almost identical to the input voltage and the FFT is not any better. \$\endgroup\$
    – alex dex
    Commented Dec 28, 2020 at 11:44
  • \$\begingroup\$ The pulse width is too long. Why \$1ms\$ (try the \$10\mu s\$ I mentioned)? Your rise/fall times can also be made smaller. The reason the simulation slows down is because of the very strict tolerances. \$\endgroup\$
    – Sven B
    Commented Dec 28, 2020 at 12:09
  • \$\begingroup\$ I updated my post with more info and a screenshot of my results. \$\endgroup\$
    – Sven B
    Commented Dec 28, 2020 at 12:33
  • \$\begingroup\$ Thanks for the update. I did my simulation with a voltage of 100k to get unity area that's why I think the simulation was slowing down. I did it again with 1 and I got your results aka the results I wanted. Thank you very much for you kindness and patience in answering my questions. \$\endgroup\$
    – alex dex
    Commented Dec 28, 2020 at 13:27
  • 1
    \$\begingroup\$ @alexdex Yeah sure, just make the tolerances less strict. Listen, don't expect the simulator to give you perfect results. Whatever your professor wants you to do, this is far from an ideal way to get the inpulse response, and you need more knowledge about simulators than you need about impulse responses. If you want the impulse response in a fraction of a second, simply run an AC analysis instead, since your circuit is linear... In this case, that would be the preferred way. \$\endgroup\$
    – Sven B
    Commented Dec 28, 2020 at 13:52
1
\$\begingroup\$

The source that you're showing in the last pictures is a good approach: it has unity area, but you forgot to adjust that to the filter in question. The time constant for the filter is 100 * 1 µs = 100 µs, while the pulse width is 1 ms, or 10 times larger. It also has too sharp rise/fall times. They will work, but there's no need to exaggerate: making them 1000 times smaller than the pulse width is enough. It's physically impossible to have them zero.

Try making the source pulse 0 1g 0 1p 1p 999p. Or use a step source (pwl 0 0 1p 1) and differentiate the output with a G source and a unity inductance in parallel (as mentioned by Neil_UK). However you decide to do it, the result will be an output in the GV range, which will obscure the result, so you'll have to either zoom the Y axis, or use a limiter at the output to avoid the "Dirac" impulse to show. For example a simple E source with table(-10k, -10k, 0, 0). I chose this value because that's the minimum value the impulse response has:

$$\mathcal{L}^{-1}\left(\dfrac{s}{s+\dfrac{1}{RC}}\right)=\delta(t)-\dfrac{1}{RC}\text{e}^{-\frac{t}{RC}}=\delta(t)-10^4\text{e}^{-10^4t}$$

Another way would be to simply perform a frequency analysis (.AC) for, say ±3 decades from the corner frequency (~1.6 kHz), and then perform an (I)FFT on that. You may need some 1k points for .AC or more, maybe even more decades, for a good enough IFFT.

Note that using a FFT on the .TRAN analysis will not give you what you're looking for, since the source can never be modelled as a good Dirac source. You could try to use the distribution formula for it, but that won't work, either:

$$\delta(t)=\dfrac{1}{|a|\sqrt{\pi}}\text{e}^{-\frac{x}{a}^2}$$

It might have something to do with Dirac being a pure mathematical concept, not physically possible. So you're left with two choices: either try to approximate the impulse response in .TRAN, or find the frequency response in .AC, using conventional methods.

\$\endgroup\$
6
  • 1
    \$\begingroup\$ Solid answer....BUT you ruined the whole thing by forgetting the little minus one thingy on the fancy-pants L. Unforgivable. \$\endgroup\$
    – Ste Kulov
    Commented Dec 28, 2020 at 9:06
  • 1
    \$\begingroup\$ @SteKulov Thank you for the correction. Now I will go to my corner. \$\endgroup\$ Commented Dec 28, 2020 at 10:29
  • \$\begingroup\$ When I changed the input voltage to the one suggested here [pulse 0 1g 0 1p 1p 999p], the output voltage looked exactly like the input voltage. This is a problem I've been running into whenever I have used a pulse width below 1n. \$\endgroup\$
    – alex dex
    Commented Dec 28, 2020 at 11:38
  • 1
    \$\begingroup\$ @alexdex It's not the same, and I said why in the answer. If you plot V(out,in), you'll see the difference, and the reason I mentioned that output limiter. \$\endgroup\$ Commented Dec 28, 2020 at 12:25
  • \$\begingroup\$ Thank you @aconcernedcitizen for you thorough and detailed answers. I'm afraid since I'm new to LTspice I'm not quite familiar with the different methods you suggested so I couldn't quite make full use of your solutions but I'm sure someone else will find it useful. \$\endgroup\$
    – alex dex
    Commented Dec 28, 2020 at 13:32

Your Answer

By clicking “Post Your Answer”, you agree to our terms of service and acknowledge you have read our privacy policy.

Not the answer you're looking for? Browse other questions tagged or ask your own question.