0
\$\begingroup\$

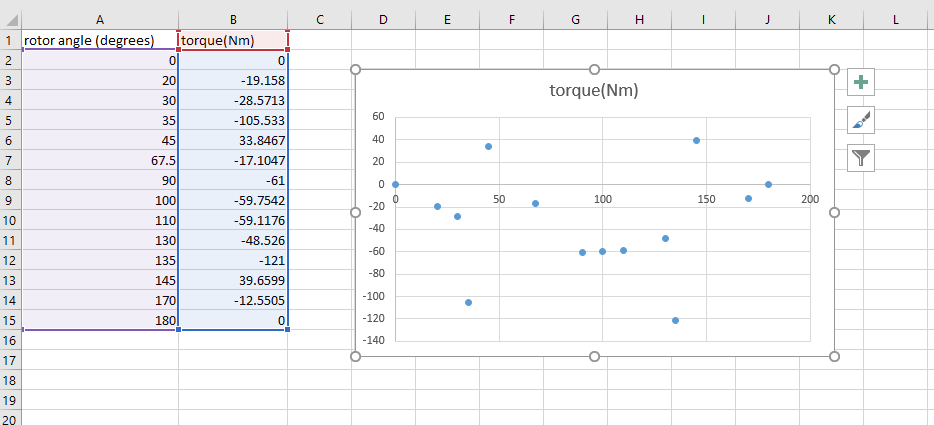
I have designed a inset PMSM. I tried to plot the torque vs. rotor position plot but I am not getting a bell curve. Like at the torque must be maximum only when theta is 90 degrees.

I don't know where the mistake is. Is it due to the phase currents? I have given the phase currents as Ir=-2Im, Iy=Im, Ib=Im, where Im is 4A.

I think this is where the mistake is. Justify my statement and also theta is taken with respect to phase R as reference and the rotor position or rotor load angle is evaluated.

enter image description here

\$\endgroup\$
8
  • 3
    \$\begingroup\$ how about providing a schematic, description of what you are measuring/plotting, sample results and so on? There are some fine engineers on here but not so many psychics. \$\endgroup\$
    – danmcb
    Commented Jun 8, 2021 at 14:20
  • \$\begingroup\$ What do you get? \$\endgroup\$
    – user76844
    Commented Jun 8, 2021 at 14:28
  • \$\begingroup\$ You should get a sine/cosine curve, not a bell curve. But without plots, we can just guess. \$\endgroup\$ Commented Jun 8, 2021 at 14:41
  • \$\begingroup\$ Sorry for the inconvenience but i could get only these values as i use FEMM to calculate the torque for each rotor position and it already took me a lot of time, but as you can see clearly, this doesn't depict a bell curve. \$\endgroup\$ Commented Jun 8, 2021 at 14:44
  • \$\begingroup\$ @MarkoBuršič I am trying to plot a torque Vs rotor position curve, this must represent a bell curve. As you know, the increase in load angle increases the torque up to 90 degrees, then it starts decreases... \$\endgroup\$ Commented Jun 8, 2021 at 14:46

0

Your Answer

By clicking “Post Your Answer”, you agree to our terms of service and acknowledge you have read our privacy policy.

Browse other questions tagged or ask your own question.