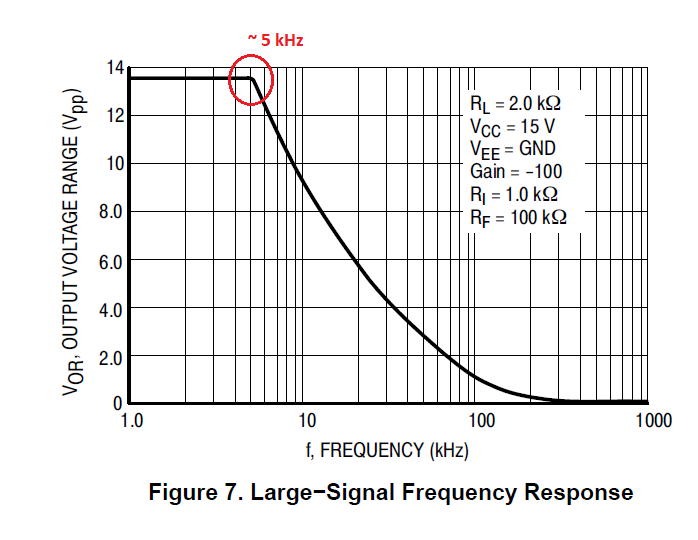
Here you have an answer via a graph which is present in the specification of the op-amp or you can calculate it. (example of LM324 https://www.onsemi.com/pdf/datasheet/lm324-d.pdf figure 7)
LM324 is a "new replacement" of old LM741. The slew rate are the same, but I did not find the graph for LM741, but only slew rate in the datasheet.
Signal input, \$V = A . sin( 2\pi ft )\$
Take derivative ...
\$dV/dt = 2\pi fA . cos( 2\pi ft)\$ --- this is maximum when \$ t=0\$
So, \$(dV/dt)_{max}\$ = \$2\pi fA\$ --- this a hyperbolic function: \$A\$ vs \$f\$
\$ \therefore f_{max} = \text{solve } \{(dV/dt)_{max} = \text{SR}\$, at \$ f=f_{max}\}\$ ; -- where \$\text{SR}\$ = op-amp slew rate
\$\implies f_{max}= \text{SR} / (2A\pi)\$
\$\text{SR}\$ for LM741 = \$0.5V /\mu s\$, and amplitude \$A = 15 V\$
\$\therefore f_{max} = 5.305 \text{ kHz}\$
At low frequencies, \$(dV/dt)_{max}\$ of "sinusoid" is lower than slew rate ... amplitude max.
At high frequencies, \$(dV/dt)_{max}\$ becomes higher ... so amplitude must be lower ...
The breaking point is where \$(dV/dt)_{max} = \text{SR} \$.
I called fmax because it is the highest frequency you can use the full range of output swing. it is also the breakpoint of the "hyperbolic" curve.
How using the \$(dV/dt)_{max}\$. Examples : amplitude \$A = 15 V\$
@ \$50 \text{ Hz}\$, \$(dV/dt)_{max}\$ = \$2\pi fA = 4710 < \text{SR} = 500000 V/s\$ or \$0.5V /\mu s\$ ...
@ \$5000 \text{ Hz}\$, \$(dV/dt)_{max}\$ = \$2\pi fA = 471000 <= \text{SR} = 500000 V/s\$ or \$0.5V /\mu s\$ ...
Amplitude (without distortion) vs Frequency plot:


