2
\$\begingroup\$

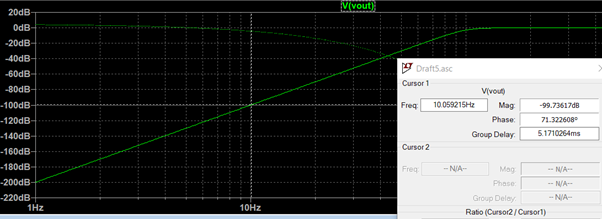
I simulated a 5th order active high pass filter on LTSpice. However I find that the output voltage does not have same attenuation as the magnitude response plot.

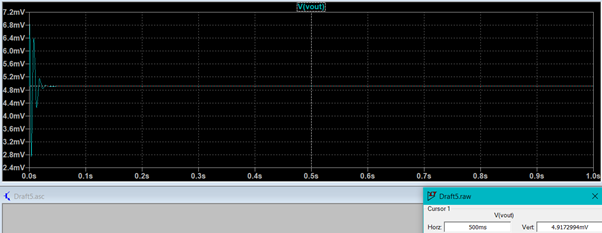
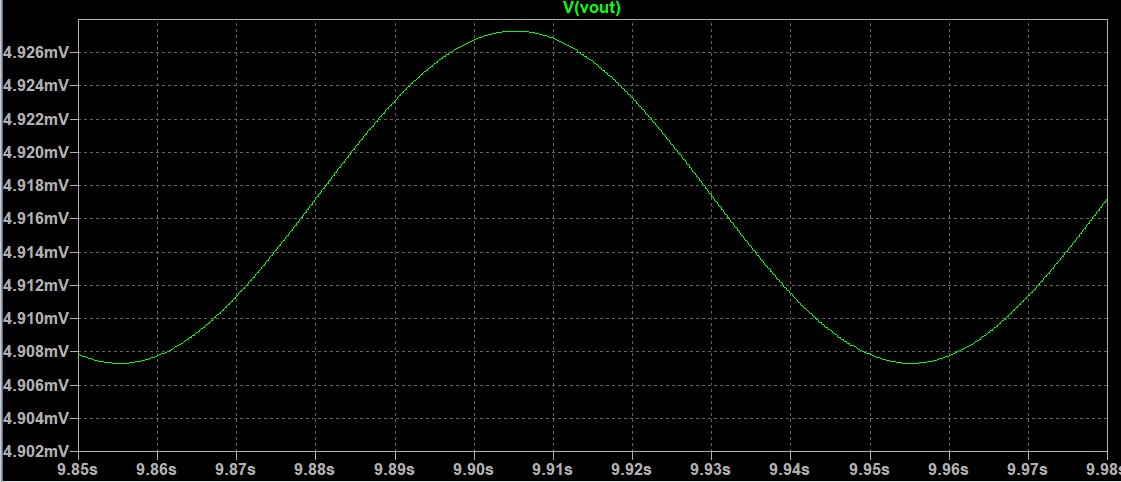
At 10Hz it is expected to have a 100dB attenuation which should yield 10uV. However, the transient simulation shows that the output voltage is 4.91mV which is only -46dB with respect to a 1V 10Hz input.

Is this some form of op-amp saturation or an error in the circuit? I'm still new to simulating circuits.

enter image description here

enter image description here

enter image description here

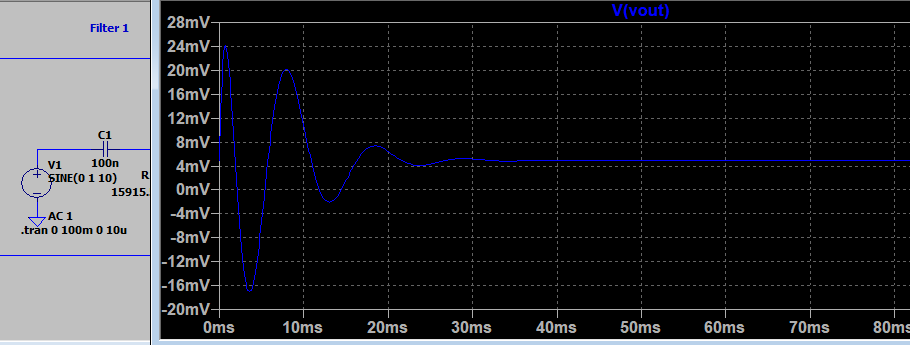
EDIT: TRANSIENT SIMULATION INPUT enter image description here

EDIT 3:

enter image description here

\$\endgroup\$
2
  • \$\begingroup\$ What response are you simulating? Step response? Sinusoidal input? Impulse response? \$\endgroup\$
    – Carl
    Commented Jan 28, 2022 at 14:48
  • \$\begingroup\$ its a 1V SINE at 10Hz I have re-edited to include my input \$\endgroup\$
    – FreddyBoat
    Commented Jan 28, 2022 at 15:34

1 Answer 1

2
\$\begingroup\$

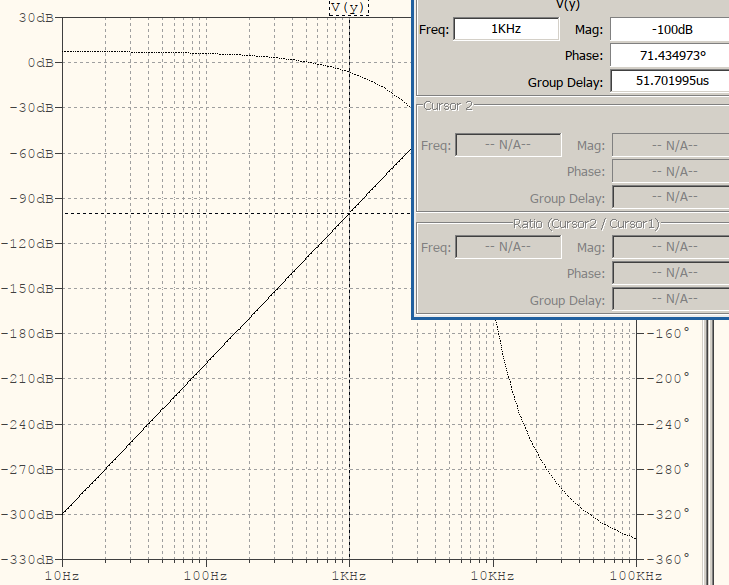
You have a high dynamic range so you need to tell the solver to tighten the timestep. For example here's a 5th order Butterworth highpass with a 100 dB attenuation at 1 kHz:

.AC

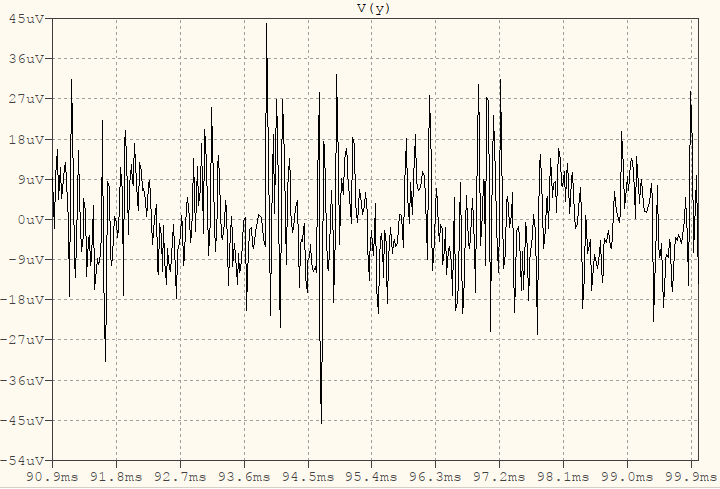
And here is how the simulation looks like with no timestep imposed for an input sine of 1 V, 1 kHz (.tran 100m):

no timestep

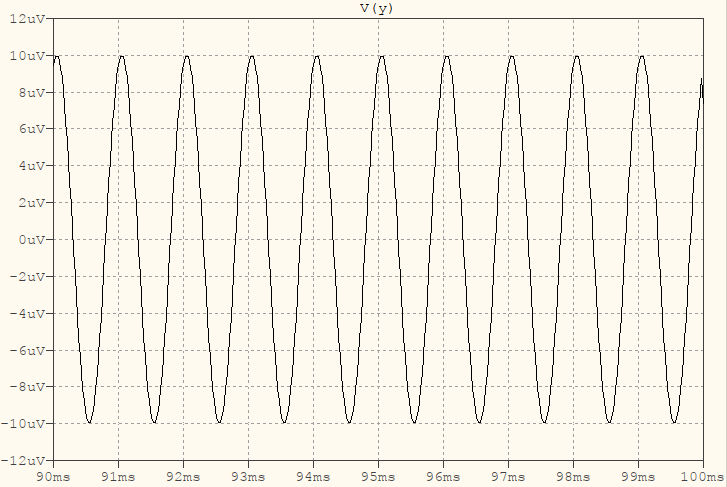
versus a 10 μs imposed timestep (.tran 0 100m 0 10u):

with timestep

Optionally, you may want to disable waveform compression by adding .opt plotwinsize=0 to the schematic, but be careful because the .RAW file may grow unruly.

\$\endgroup\$
15
  • \$\begingroup\$ I have changed the timestep as per your suggestion however I think timestep may not be the issue? I have added my required input in edit (1V SINE at 10Hz) \$\endgroup\$
    – FreddyBoat
    Commented Jan 28, 2022 at 15:35
  • \$\begingroup\$ @FreddyBoat If you look at the last two pictures above you'll see that the timescale shows 90m ... 100m. That means I have simulated for at least 100m, out of which I zoomed in in the last portion. In your picture, not only you kept right at the beginning, but you've also not zoomed in to the uV region. Not lastly, don't forget that no real-time process is instantaneous in nature, and filters have a transient response. This is why I chose the last section of the timescale, as opposed to the beginning -- to let the transients decay. \$\endgroup\$ Commented Jan 28, 2022 at 15:50
  • \$\begingroup\$ In my second picture, my cursor is at 0.5s/500ms which isn't it considered steady state already? I looked into output at 1s as well, it seems to be going flat at 4.92..mV which zooming in and averaging waves at 4.9 does not make it to uV . Sorry, I may be misinterpreting you. \$\endgroup\$
    – FreddyBoat
    Commented Jan 28, 2022 at 16:11
  • \$\begingroup\$ @FreddyBoat In your 1st picture, yes, but then you didn't use a timestep there, did you? In your 2nd picture you did, but in both pictures you're relying on the cursors to read values in the uV range when zoomed out into V range. It's like trying to run your fingers over a glass surface and detect, bare handed, whether there are irregularities in the tens of micro meter range. Zoom in if you need details. Look at my pictures: the Y axis is in the uV range, yours is in the mV range -- that's 1000x times larger. You could barely see 0.1 mV a variation, let alone uV. \$\endgroup\$ Commented Jan 28, 2022 at 16:53
  • \$\begingroup\$ Maybe you don't know how to zoom in? I don't know what you know, but in case you don't know, if you'll open up the manual (F1) and go to Waveform Viewer > Zooming you'll see that it's as easy as click & drag with the LMouse to create a box (you'll see the cursor turning into a magnifier). \$\endgroup\$ Commented Jan 28, 2022 at 16:59

Your Answer

By clicking “Post Your Answer”, you agree to our terms of service and acknowledge you have read our privacy policy.

Not the answer you're looking for? Browse other questions tagged or ask your own question.