0
\$\begingroup\$

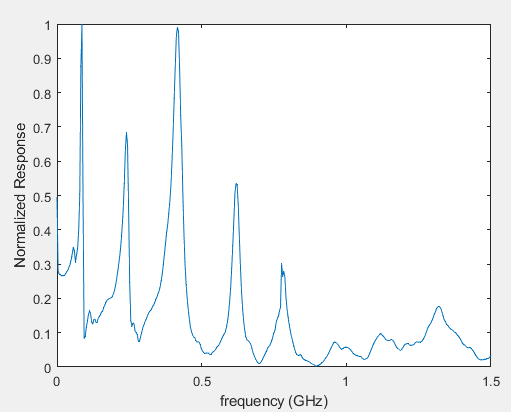
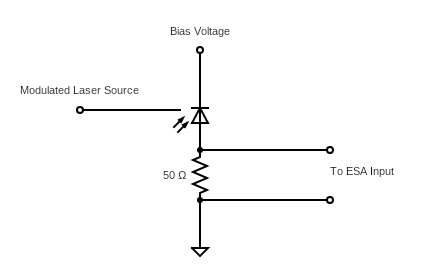
I'm currently attempting to characterize a PIN photodiode's 3 dB bandwidth. The photodiode input is a laser source that is being modulated by an ESA RF output that performs a frequency sweep from 0-1.5 GHz. The output of the photodiode is then connect to a 50 Ω resistor which is connected to ground. The ESA input terminals are connected over the 50 Ω resistor. I have two pertinent questions:

  1. The spec sheet gives a 3 dB BW of 0.7 GHz. Can a regular breadboard be used for the circuit? Currently, I have the legs of the components connected together and the components themselves in air, since I read that the parasitics of the breadboard will interfere with the measurements. I did attempt to measure it with the breadboard and didn't notice a large increase in noise.
  2. I'm using a 50 Ω resister since the input of the ESA is also 50 Ω. However, I'm still getting RF reflections in the output spectrum. I'm unfamiliar with RF circuits and measurement. How would I go about matching the impedance in a better manner?

Circuit Diagram

Normalized Frequency ResponsePhotodiode Data Sheet

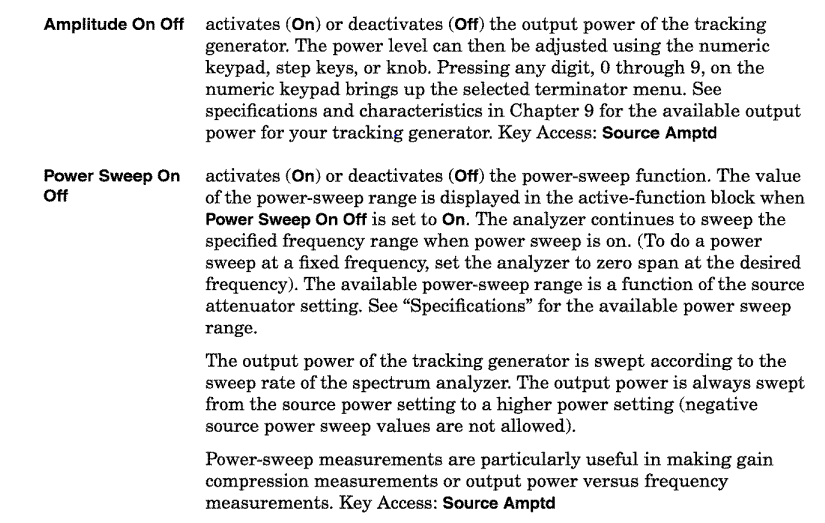
The modulation is the power sweep function from the HP L1500A: enter image description here
! Edit Previously I was using a Pulse Pattern Generator to modulate the LASER. I increased the PPG frequency until the spectrum amplitude rolled off to 1/sqrt2 value. This issue was that the spectrum was extremely noisy, and near impossible to get an accurate reading of the roll off.

\$\endgroup\$
12
  • 2
    \$\begingroup\$ How do you know you're getting output reflections? Can you show us whatever scope traces, TDA outputs, or spectrum analyzer outputs that lead you to believe this is happening? \$\endgroup\$
    – TimWescott
    Commented Mar 24, 2023 at 20:36
  • 2
    \$\begingroup\$ While you're editing your question with the above information, could you also give us the part number of the photodiode. Look through the data sheet and make sure that they don't document the test fixture they used to get their measurements -- that's pretty common, especially when the specifications are this tight. \$\endgroup\$
    – TimWescott
    Commented Mar 24, 2023 at 20:37
  • 2
    \$\begingroup\$ A photograph of your test setup would be good, too -- those reflections may be in the optical path. \$\endgroup\$
    – TimWescott
    Commented Mar 24, 2023 at 20:37
  • 1
    \$\begingroup\$ I don't feel I can fully answer this question, but a big part of the answer is that your test fixture needs to start with a purpose-designed board with impedance-controlled traces, with connectors that are good up or beyond the highest frequency you're applying. Wires floating in space are not going to cut it. \$\endgroup\$
    – TimWescott
    Commented Mar 24, 2023 at 20:43
  • 1
    \$\begingroup\$ If you're not comfortable designing the PCB, then you should solder directly to a coax, which is functionally the same thing. However, to really use the bandwidth of these diodes you'll probably need to design a PCB. This is not something you'll find in a catalog. \$\endgroup\$ Commented Mar 25, 2023 at 3:02

2 Answers 2

1
\$\begingroup\$

The reverse biased photo diode is almost a perfect current source with a small capacitance across it. Then AC wise the 2 load resistors shunts the diode so the bandwidth is essentially 1/2/pi/R/C where C is the photo diodes capacitance and R is, in your case 25 Ohms.

The only time you get reflections is when a transmission line of sufficient length is involved. Just connecting a 100 Ohm resistor, say across a 50 Ohm resistor doesn't cause reflections.

My guess is that you are showing the spectrum of a ~100 MHz signal that is turning the light on and off, and therefore the photodiode current on and off, essentially. You don't really mention what sort of light source you are using, but if you want to measure the frequency response you have to vary the frequency of modulation on the (fiber coupled LASER I assume). If you are using a sguare wave to modulate the LASER then only pay attention to the fundamental frequency, Also I suggest turning down the modulation of the light to an optical modulation index of around 50%.

\$\endgroup\$
1
  • \$\begingroup\$ Thanks Doug. I added more information about the modulation in the post. \$\endgroup\$
    – SamsUncle
    Commented Mar 25, 2023 at 1:46
0
\$\begingroup\$

The spectrum we see is not the typical output of a power sweep. That would bt a plot of output level vs input level. The slope at small inputs would be the small signal gain, And as the input increases, eventually the gain falls off, the slope becomes less, and the point where the actual output level is 1 dB below where the small signal gain line would be is the 1 dB compression point. Instead we see a spectrum of non linear signal. It is not a frequency response. No pin diode detector and laser source would have such a response. The L1500 tracking generator should be set on frequency sweep, like testing a filter and the power level should be set to a level that keeps the source linear. Then the plot will be a scaler frequency response of the network, not a spectrum.

\$\endgroup\$

Your Answer

By clicking “Post Your Answer”, you agree to our terms of service and acknowledge you have read our privacy policy.

Not the answer you're looking for? Browse other questions tagged or ask your own question.