2
\$\begingroup\$

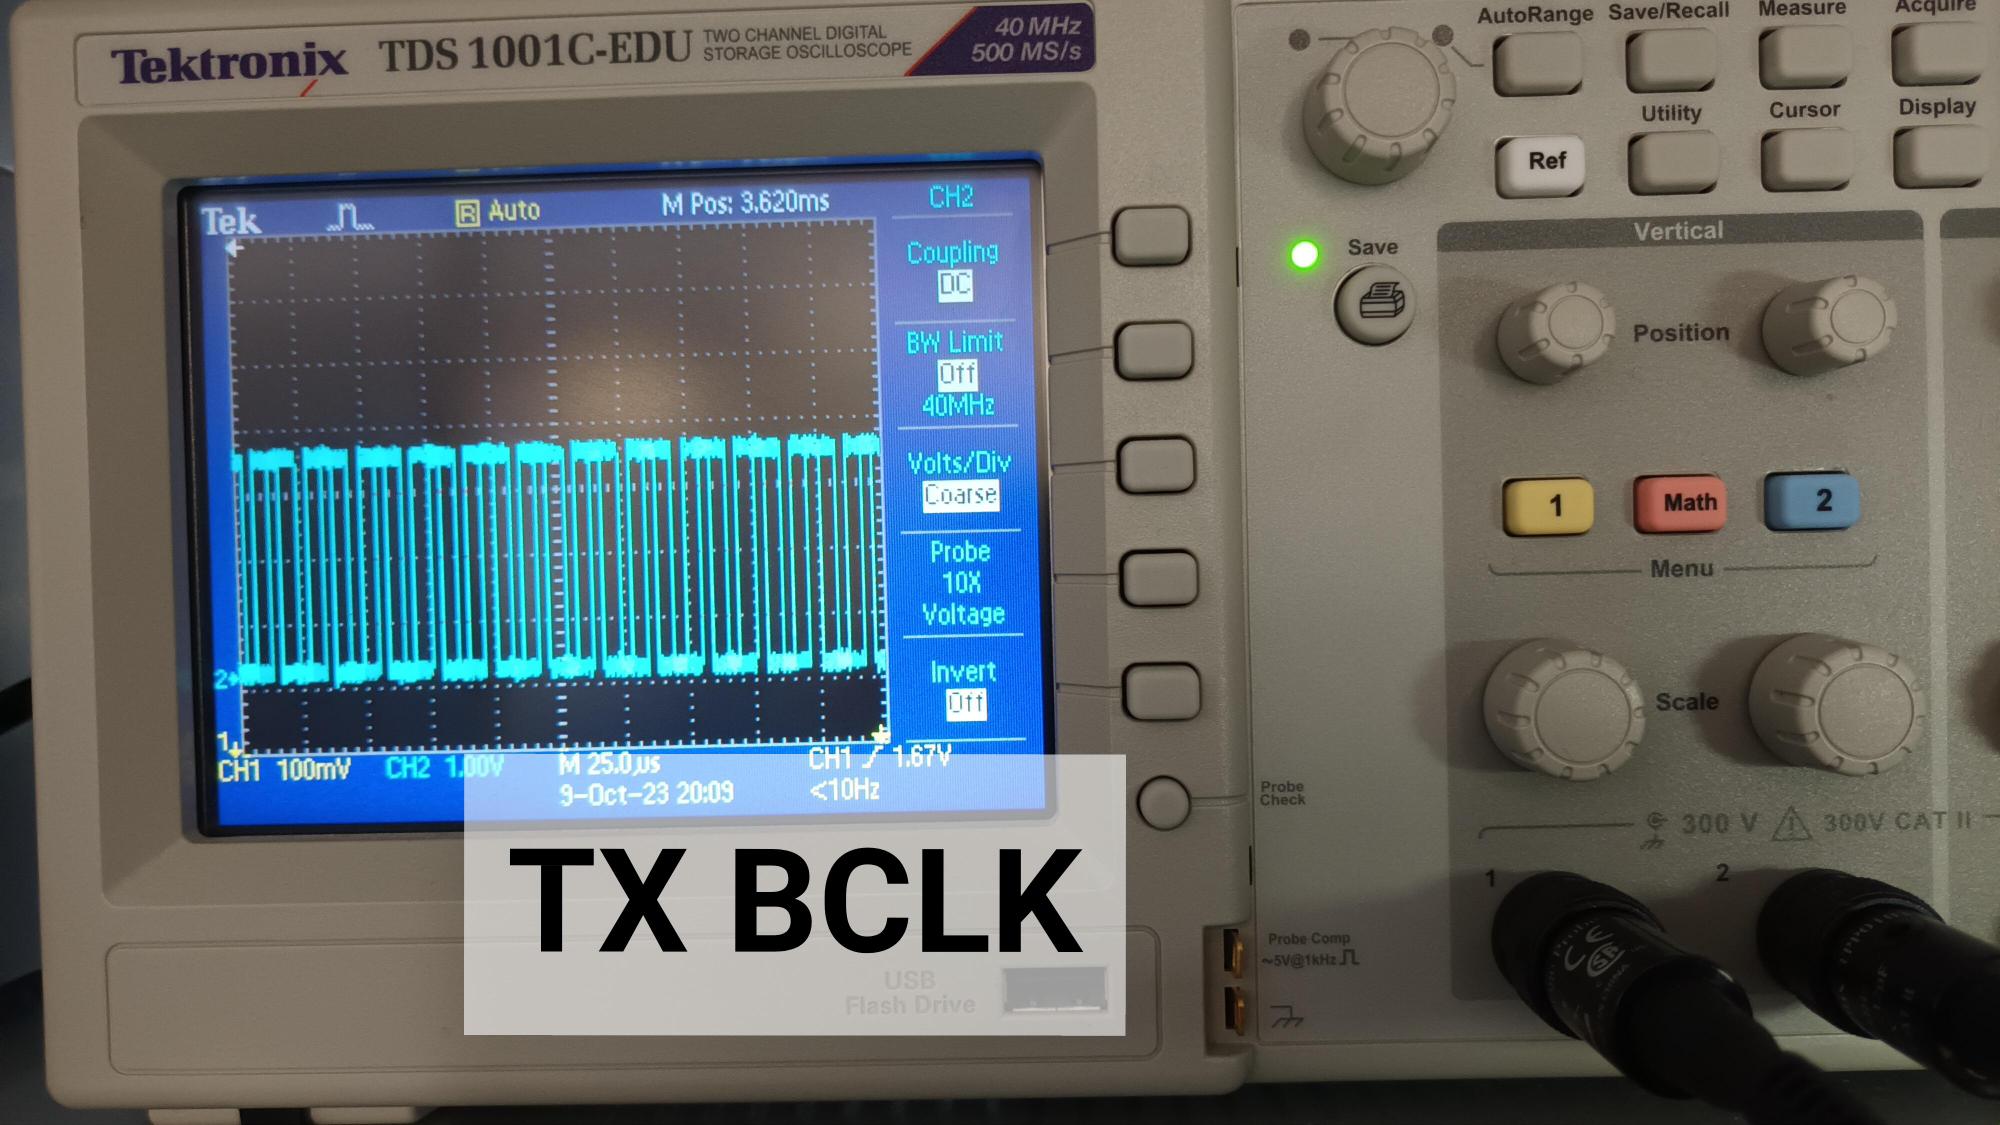
I'm working with one of the devices from the NXP's IMX family - the IMX93 evaluation board. I've managed to setup the sound card drivers already, the next step was to test I2S signals output via the expansion connector - success as well. The Bit Clock signal was as below:

enter image description here

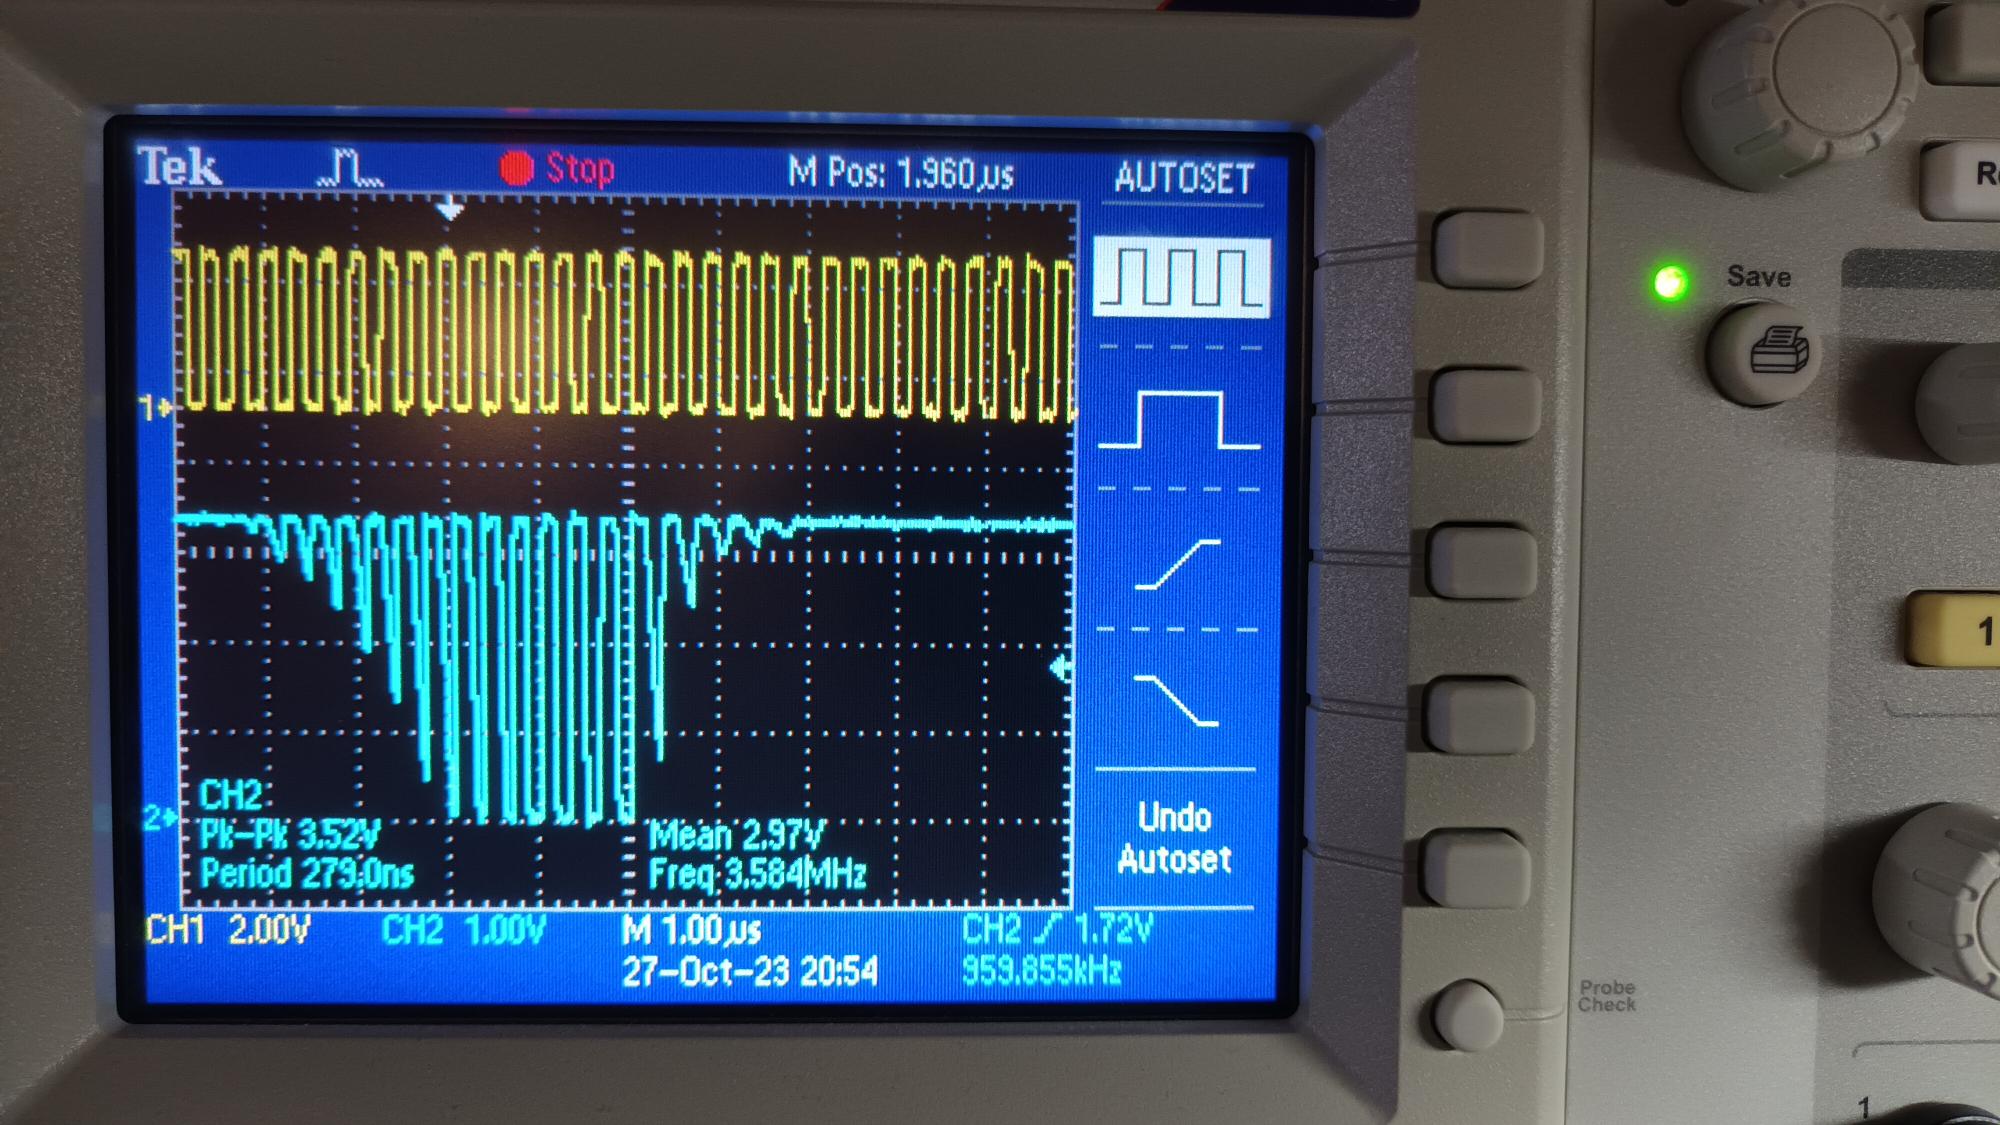
However a month later, when inspecting the BCLK signal again it seems to be degraded, resembling the original signal modulated with a sine. Below picture presents a comparison of the same signal being output by a Raspberry Pi configured with the same sound card (yellow) and again the IMX93. Ideally both signals would look the same.

enter image description here

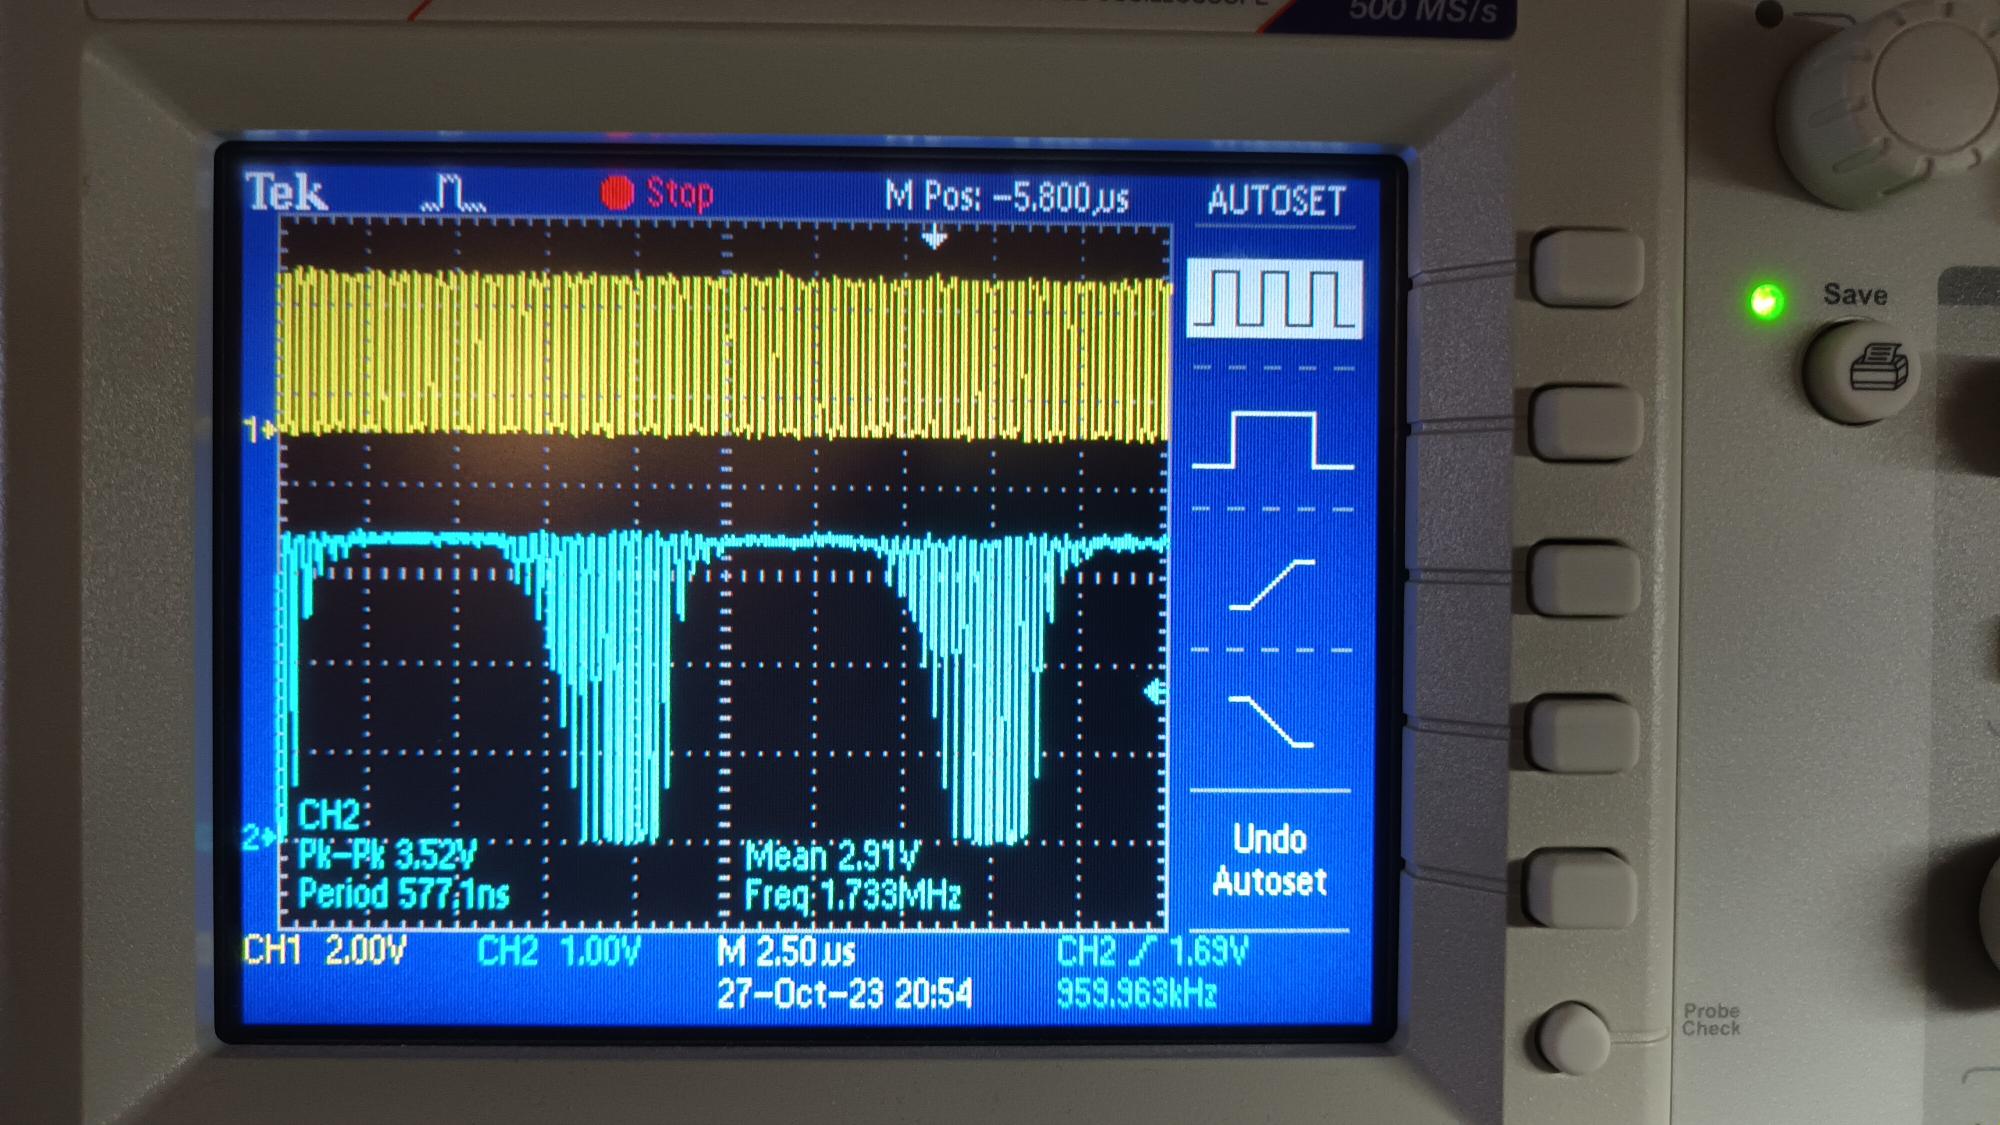
More pictures of RPI vs IMX:

enter image description here

What could be the cause of this degradation?

\$\endgroup\$
1
  • \$\begingroup\$ What are your scope settings? Does it sample often enough to see the signal? What is the clock frequency and what is the sampling rate of the scope at the zoom level you chose? \$\endgroup\$
    – Justme
    Commented Oct 30, 2023 at 14:30

1 Answer 1

0
\$\begingroup\$

All three traces appear to show sampling artifacts suggesting that you sample rate is too low relative to the signal you are viewing.

In the first trace you don't see a clean square wave, rather something with multiple edges and semi-random tops. In the latter cases, it looks like tha sample/signal timing is slightly different and the aliasing artefacts give the impression of signal variation.

I would think that if you double or treble the sample rate (depending on you scope just narrowing the time base will help), then you should see a clean signal in all cases.

\$\endgroup\$
4
  • \$\begingroup\$ I'll take a look at the sampling rates. I'm worried about the huge difference between the yellow and the blue plot, they both were sampled with the same sampling frequency, they both should output clocks of the same frequency, yet the yellow one is at all as distorted as the blue one. Unless there were actually different sampling rates for every channel and I just didn't see that in the configuration. Thanks for the advice! \$\endgroup\$
    – Antoni
    Commented Nov 3, 2023 at 8:54
  • \$\begingroup\$ Could there be any significance to what looks like exponential decay in the signal amplitude? Like a bad capacitor? \$\endgroup\$ Commented Nov 3, 2023 at 10:28
  • \$\begingroup\$ Given the lack of details on sampling rate and expected signal, it is hard to be certain, but if the sampling frequency is near to, but not exactly the same as the signal being monitored, then you will see the two "beating" generating a low frequency output signal. Do you know the sampling frequency of the scope and the expected frequency of the clock signal? \$\endgroup\$
    – colintd
    Commented Nov 3, 2023 at 13:27
  • \$\begingroup\$ @colintd the scope I'm using is a Tektronix TDS 1001C-EDU, 40MHz of bandwidth, 500MS/s sampling rate per channel, more about it can be found here. The signals shown in the post are captures of a BIT CLOCK output when I2S transmission happens, the sound card is set to output 96kHz of S16_LE on 2 channels, so the clock should be around 96000*2*16 = 3072000 = 3.072 MHz. That's much less than the limits of the promised 500MS/s, and the bandwidth limit of 40MHz set by the scope. \$\endgroup\$
    – Antoni
    Commented Nov 9, 2023 at 10:56

Your Answer

By clicking “Post Your Answer”, you agree to our terms of service and acknowledge you have read our privacy policy.

Not the answer you're looking for? Browse other questions tagged or ask your own question.