Background
LEDs have varying forward voltages, and the range can be significant.
Example: OSRAM LRTBGVSR RGB LED
![OSRAM LRTBGVSR : V.f @ I.f = 20 [mA]](https://i.sstatic.net/HP6nM.png) See the bottom line.
See the bottom line.
What is not provided is the statistical distribution of these tolerances.
How it is related
I am designing a battery-powered indicator LED matrix. Due to the battery, efficiency is critical; however, as there is only one LED per indicator (no redundancies), all LEDs functioning is paramount.
This becomes an optimization problem:
Do I want to design my drive with respect to the maximum possible forward voltage of the part, with the understanding that the great majority of parts will consistently burn off the overvoltage?
(Remember: These are not simply losses of usable battery power — these losses also become heat generated within the driver IC. Ick.)
Do I instead make the bus voltage variable and form tests which determine whether the full current is going out to every LED (increasing the bus voltage until it does)?
Here, if the forward voltage tolerance distribution was known, I could at least try to select an initial driving voltage which, at some cost to efficiency (but no longer maximum cost), drove all LEDs for most units, leaving a statistically manageable number of outliers afterward.
Actual Question
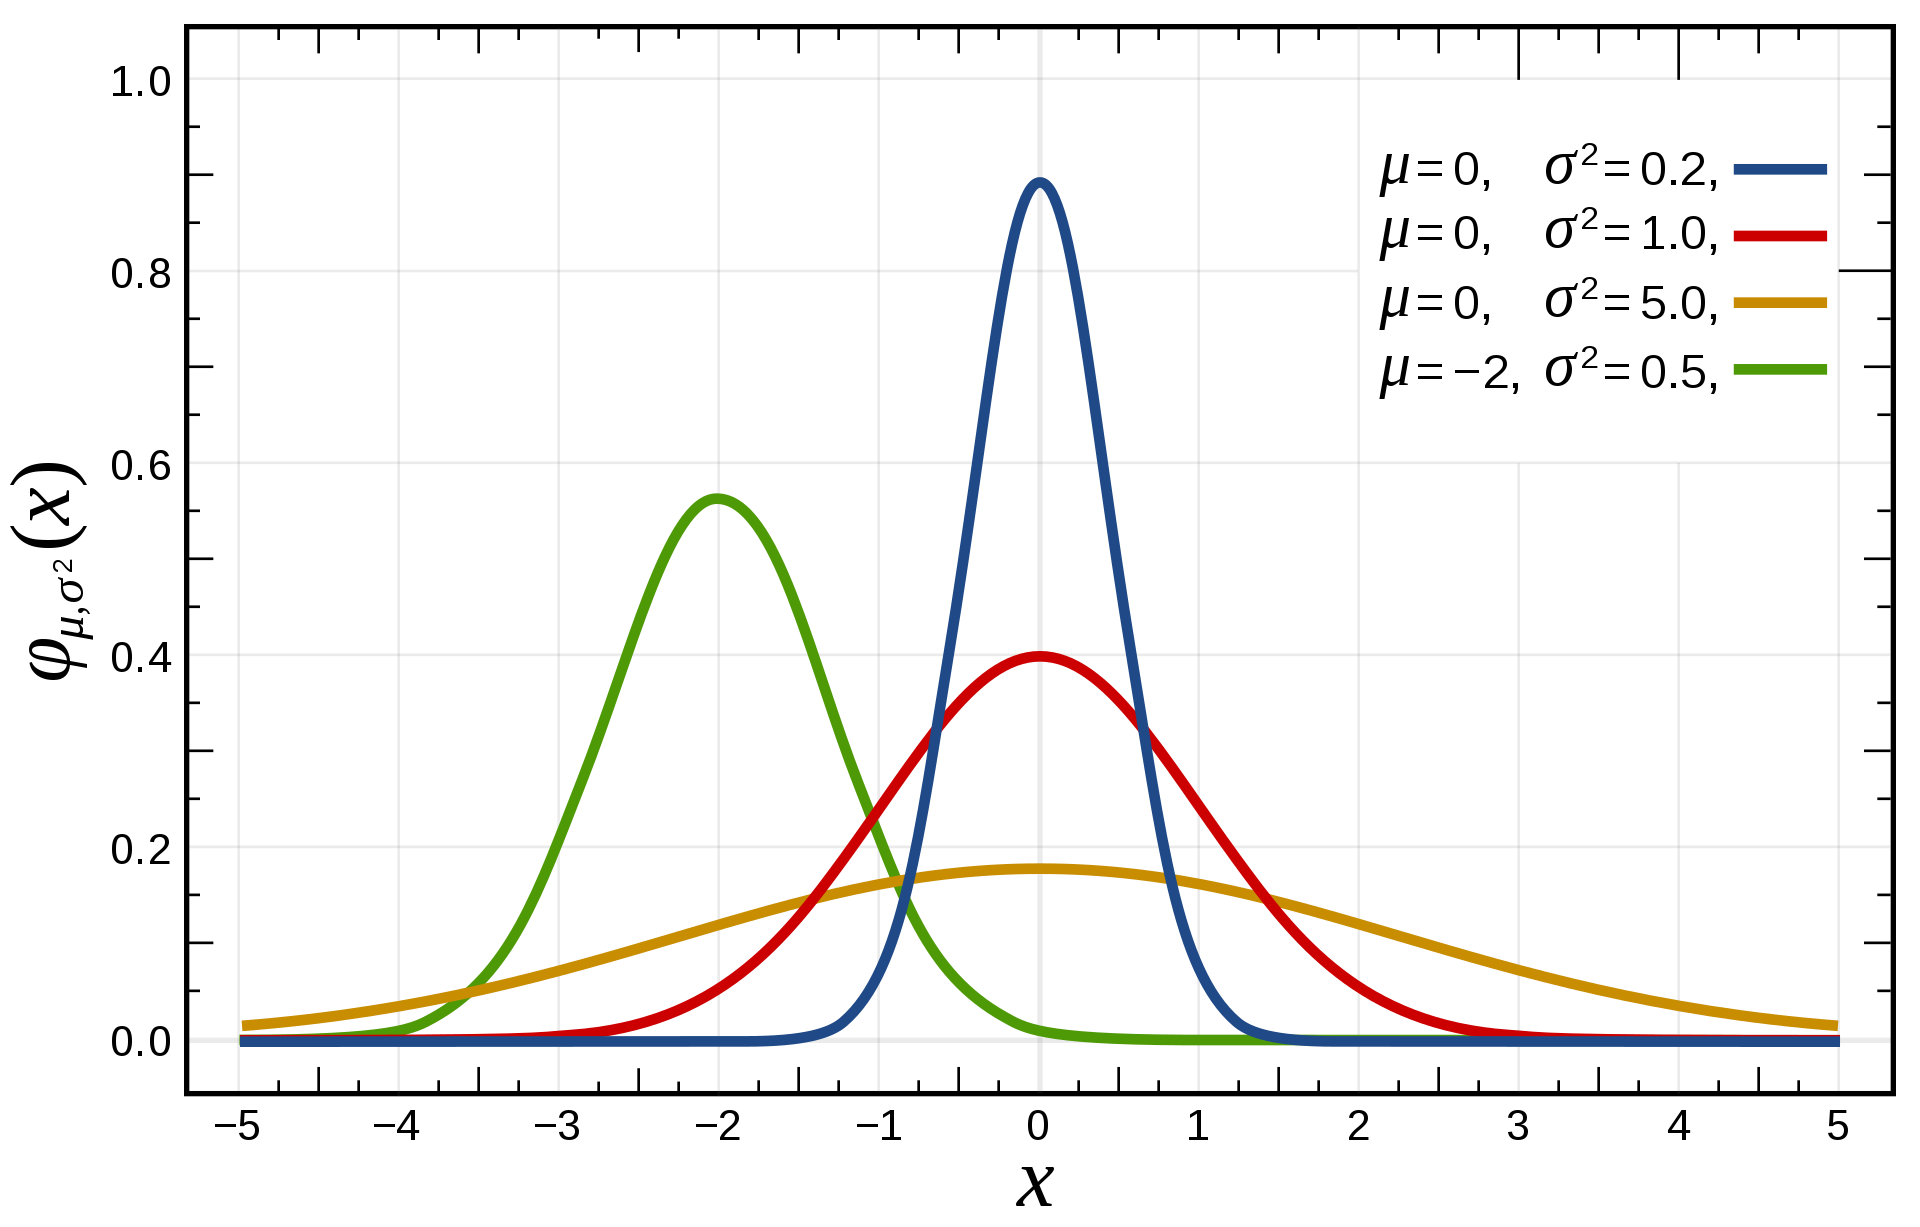
Do LED forward voltage tolerance distributions tend to be equivalent, independent of the part series?
- If so, where could these distributions be found?
- If not, would manufacturers tend to know for specific parts?
Additional Information
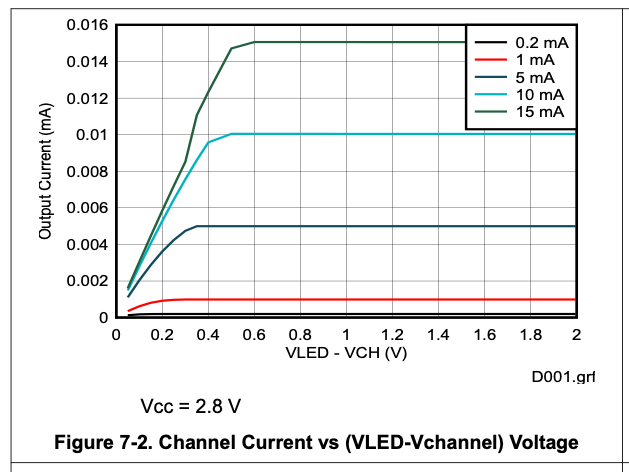
The minimum LED driving voltage for my driver is equal to the forward voltage of the LED \$V_{led.f}\$ plus a specified value, \$V_{driver.channel.knee}\$.
Example : TI TLC6983 (Constant current, PWM-capable LED driver)


