4
\$\begingroup\$

I'm a physics PhD student working on a project to use silicon photodiodes for detection of longwave infrared (6-10um) ultrashort pulses. (Specifically doing higher-order autocorrelation) Despite silicon having a bandgap of 1.12eV, it is possible to generate a nonlinear response via multi-photon and tunneling ionization in the silicon chip. Here is a simplified layout of the set-up:

Optical Layout

The laser is first sent through a variable attenuator (details not relevant) and is then focused using a lens (again, details not relevant) onto the photodiode. The variable attenuator is used because the standard approach to characterizing the nonlinear response is to graph the output signal (voltage or photocurrent) as a function of input intensity (W/cm^2) like seen in the plot below: Nonlinear Signal Vs Intensity Graph
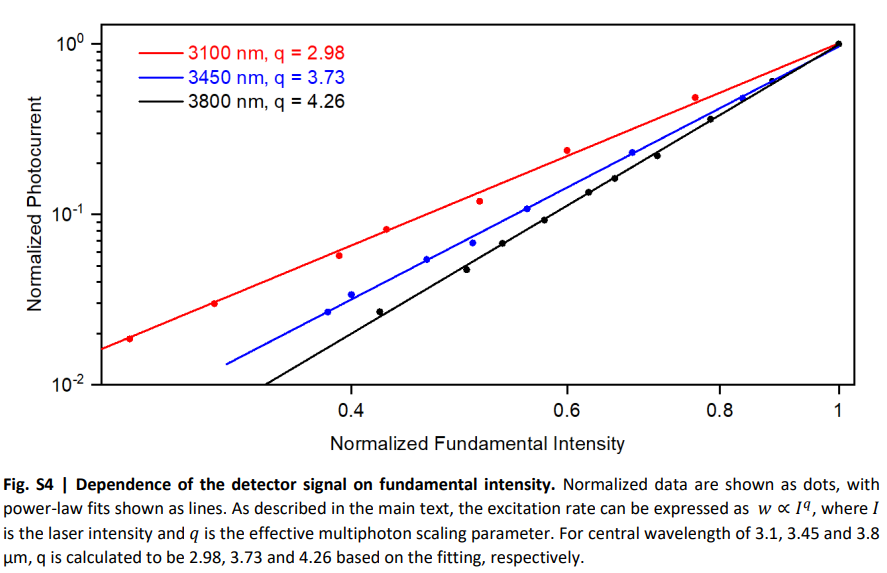
I doubt that the details of the nonlinear signal generation will be germane to an answer to my question, but I thought it best to include it anyway.

The LWIR pulse going into the photodiode is extremely short (~50fs) so the detector should see it as being practically an impulse response.

In terms of electronics, my current set-up has a PIN photodiode (Thorlabs FDS100), a detector circuit (Thorlabs DET410), a 10ft 50-Ohm BNC cable, a BNC T-Plug (One arm goes to the PD and the other arm has a 50Ohm load), and finally an Agilent DSOX-2022A ocilloscope (1MOhm input port).

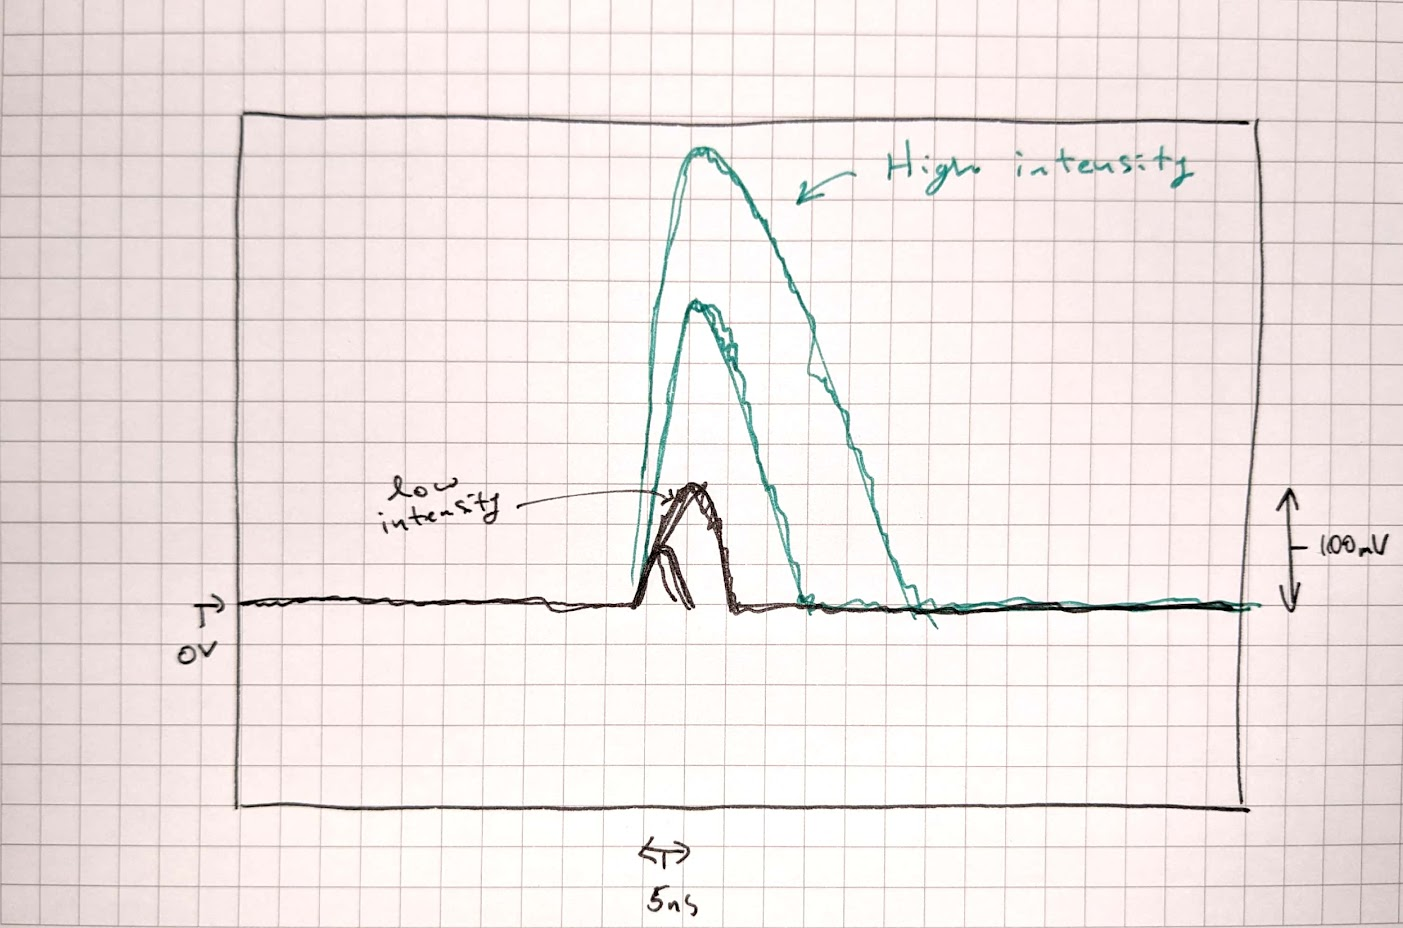
The problem I can't figure out is whether the signal I see on the O-scope is "representative" or not. Starting with very low intensity, I just start to see the signal peak out of the noise and it has a rising and falling edge a bit faster than that specified by the manufacturer. (~5ns actual, ~10ns spec). However, as I increase the intensity the rising edge stays the same, but the falling edges broadens significantly in a way that I would normally associate with a saturation effect. That being said, the voltage level is still only in the 100mV range when this broadening begins to occur and the Max Reverse Bias for the PD is 25V while the detector unit bias voltage is only 12V. Below is a drawing roughly showing this broadening effect:

Nonlinear Signal Broadening

If I increase the intensity and thereby the signal significantly I do begin to observe saturation effects on the oscilloscope (~3.6V) and this is accompanied by truly expansive broadening of the falling edge like we would normally anticipate.

So to put the question succinctly: Is there a reason, from an electronics perspective, that I should see this premature temporal broadening of the signal as I increase the intensity? Or is it possibly an actual physical effect?

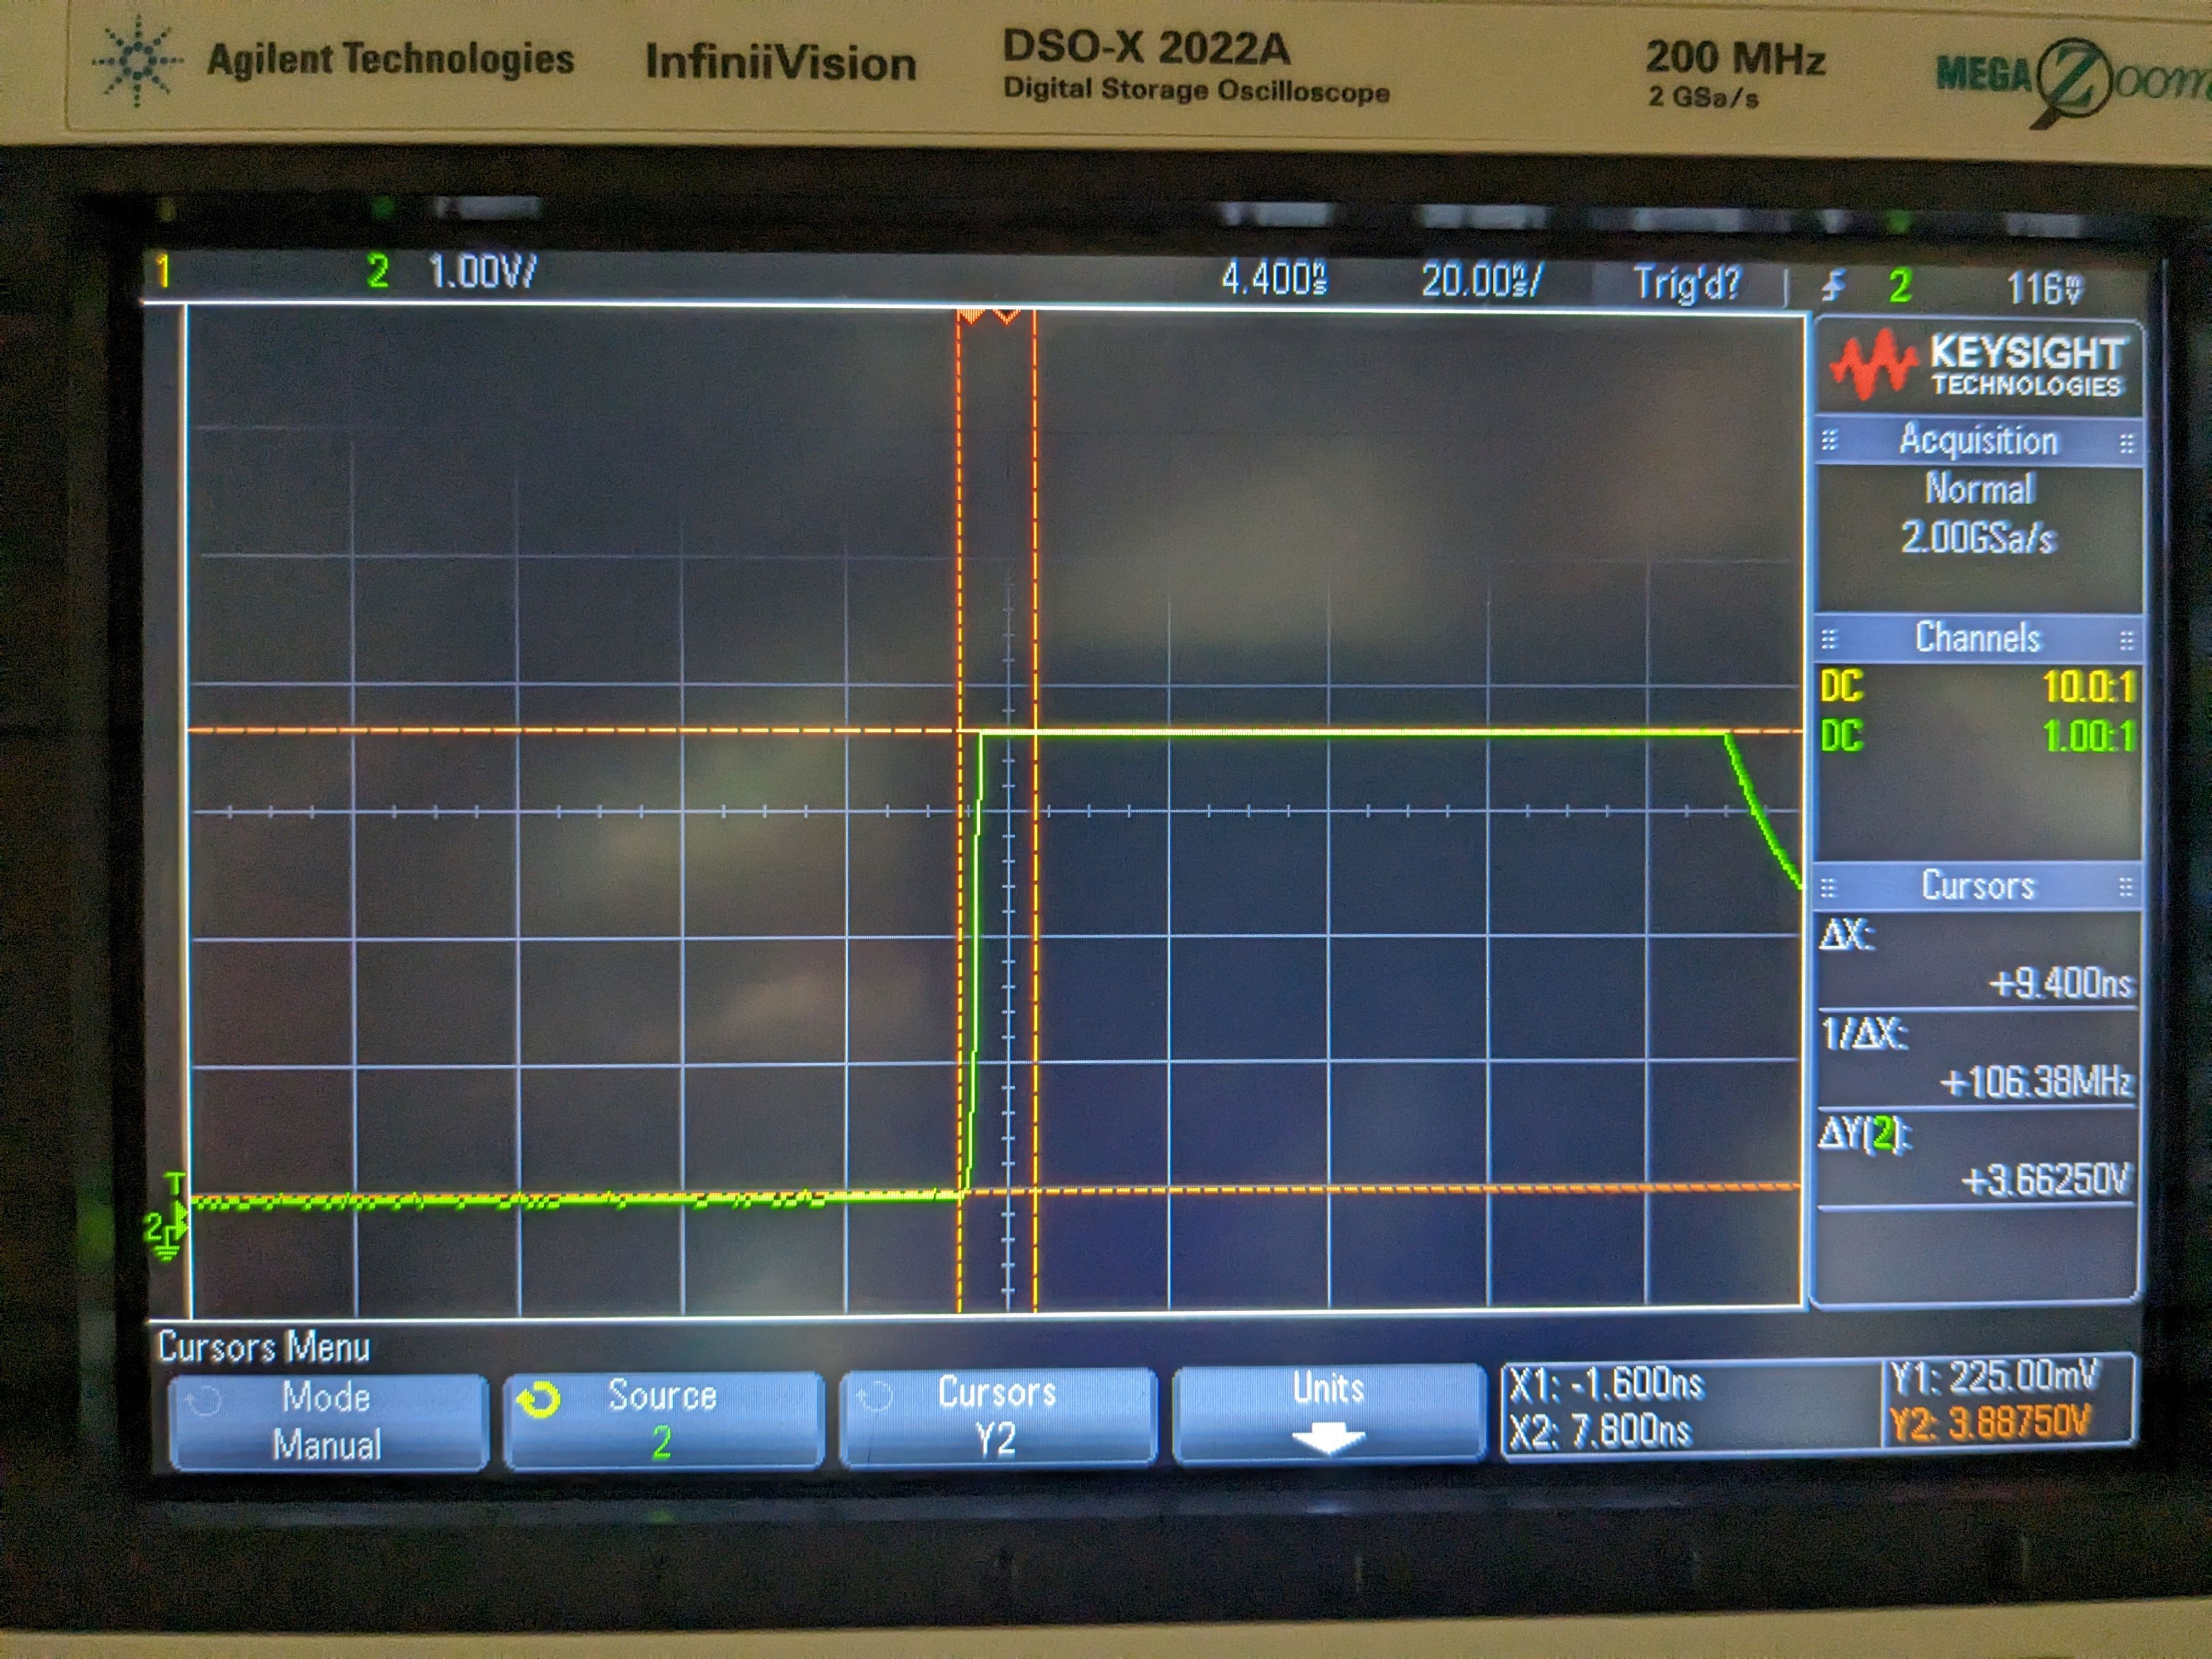
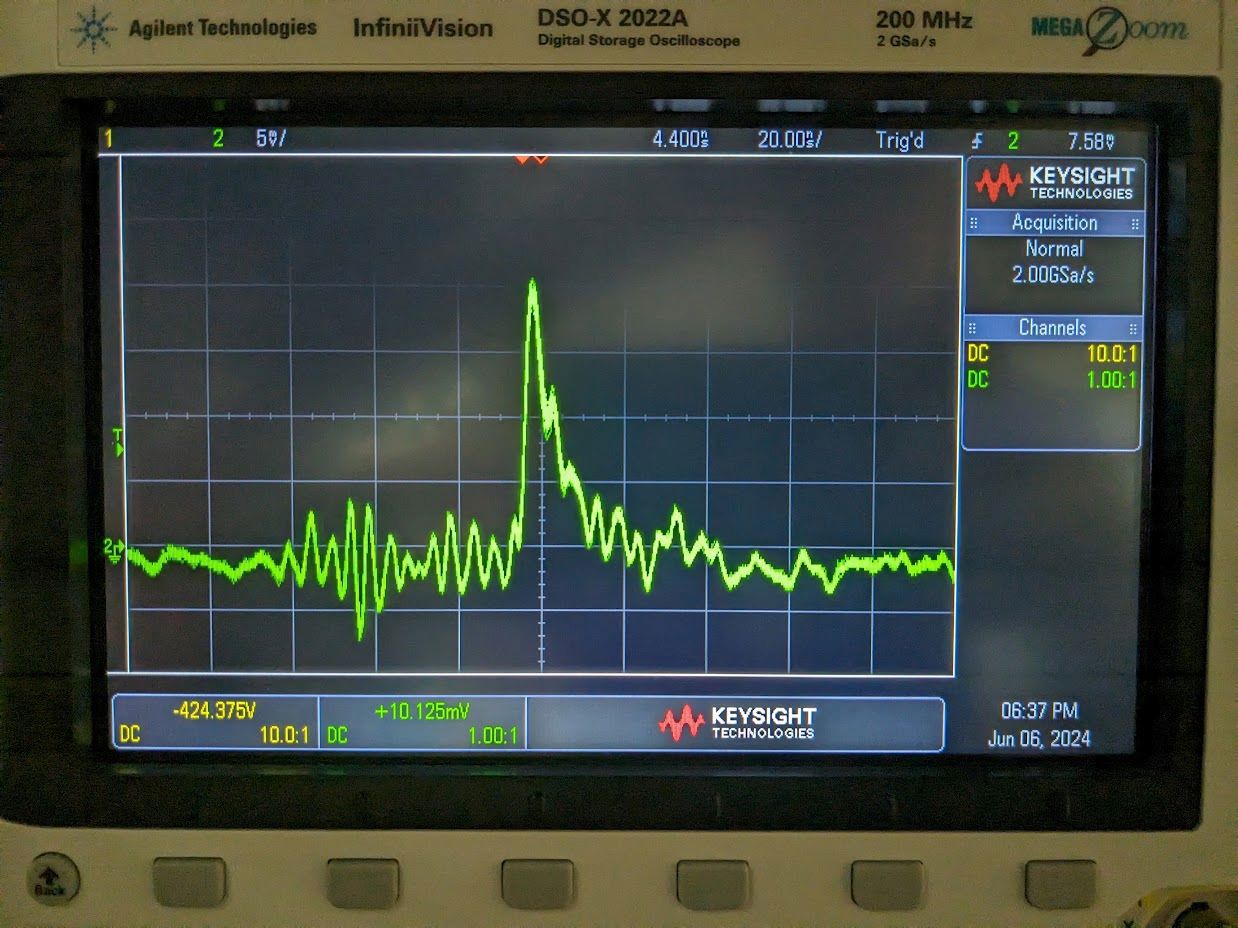
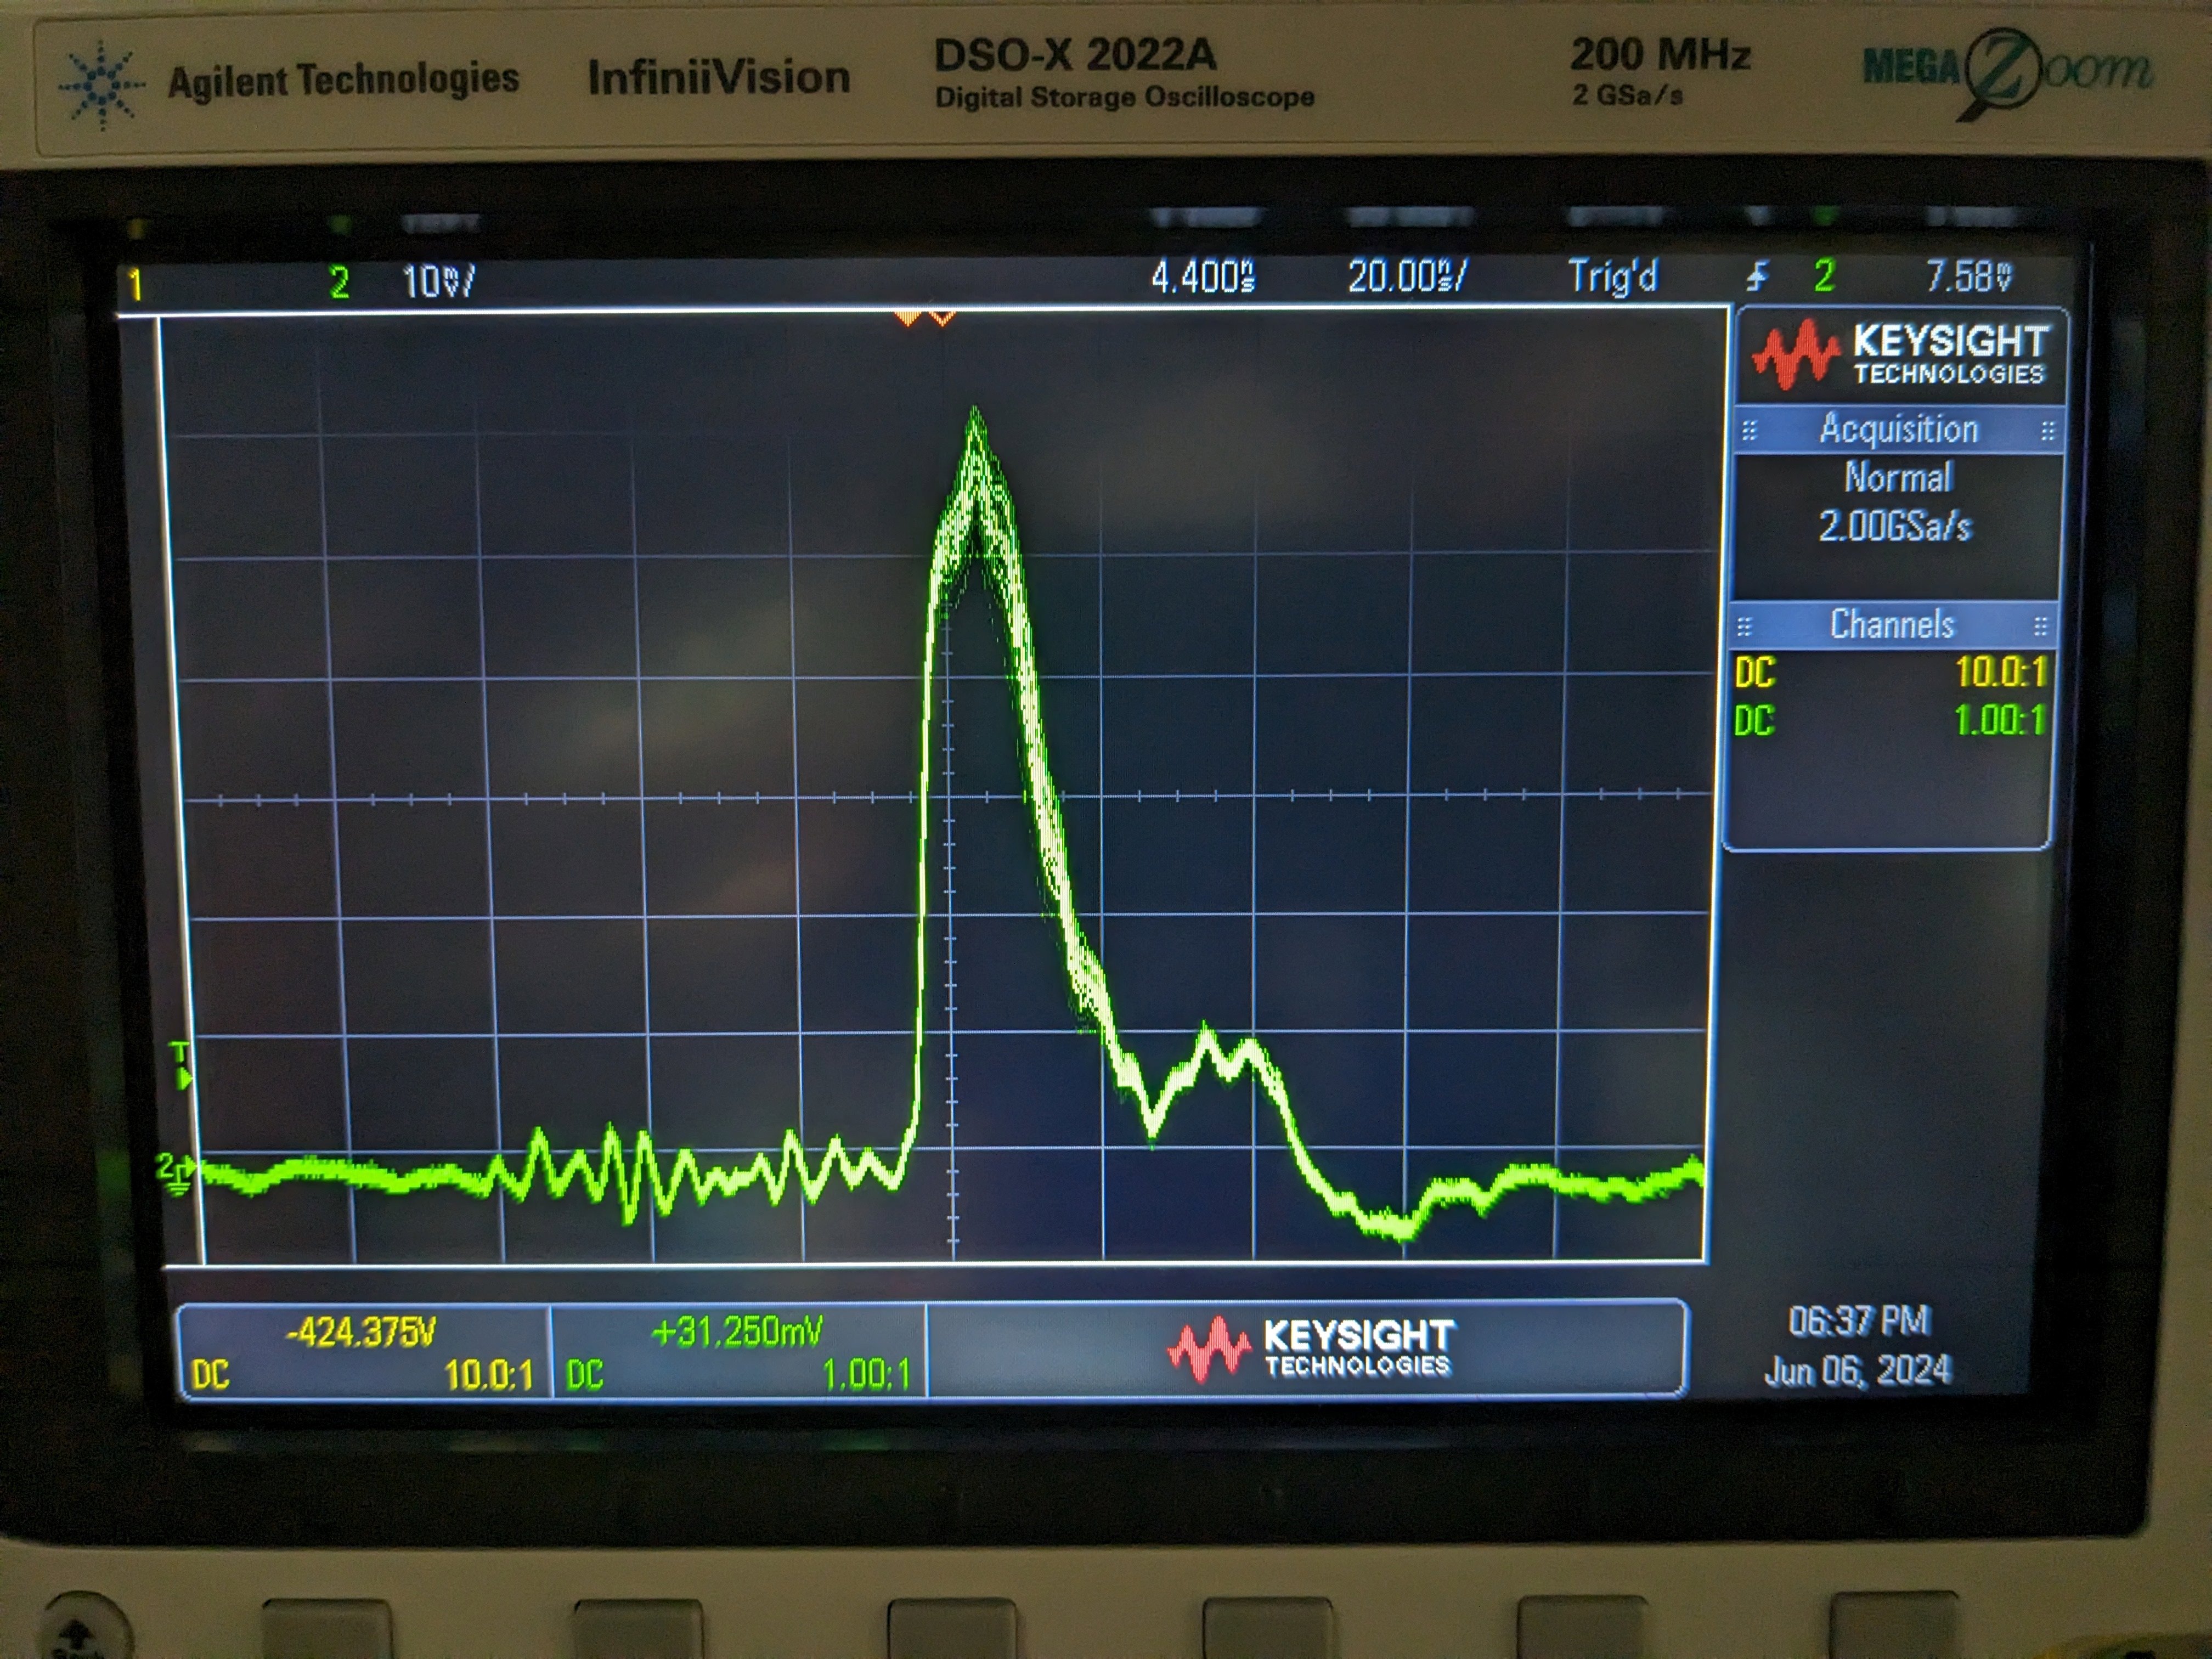
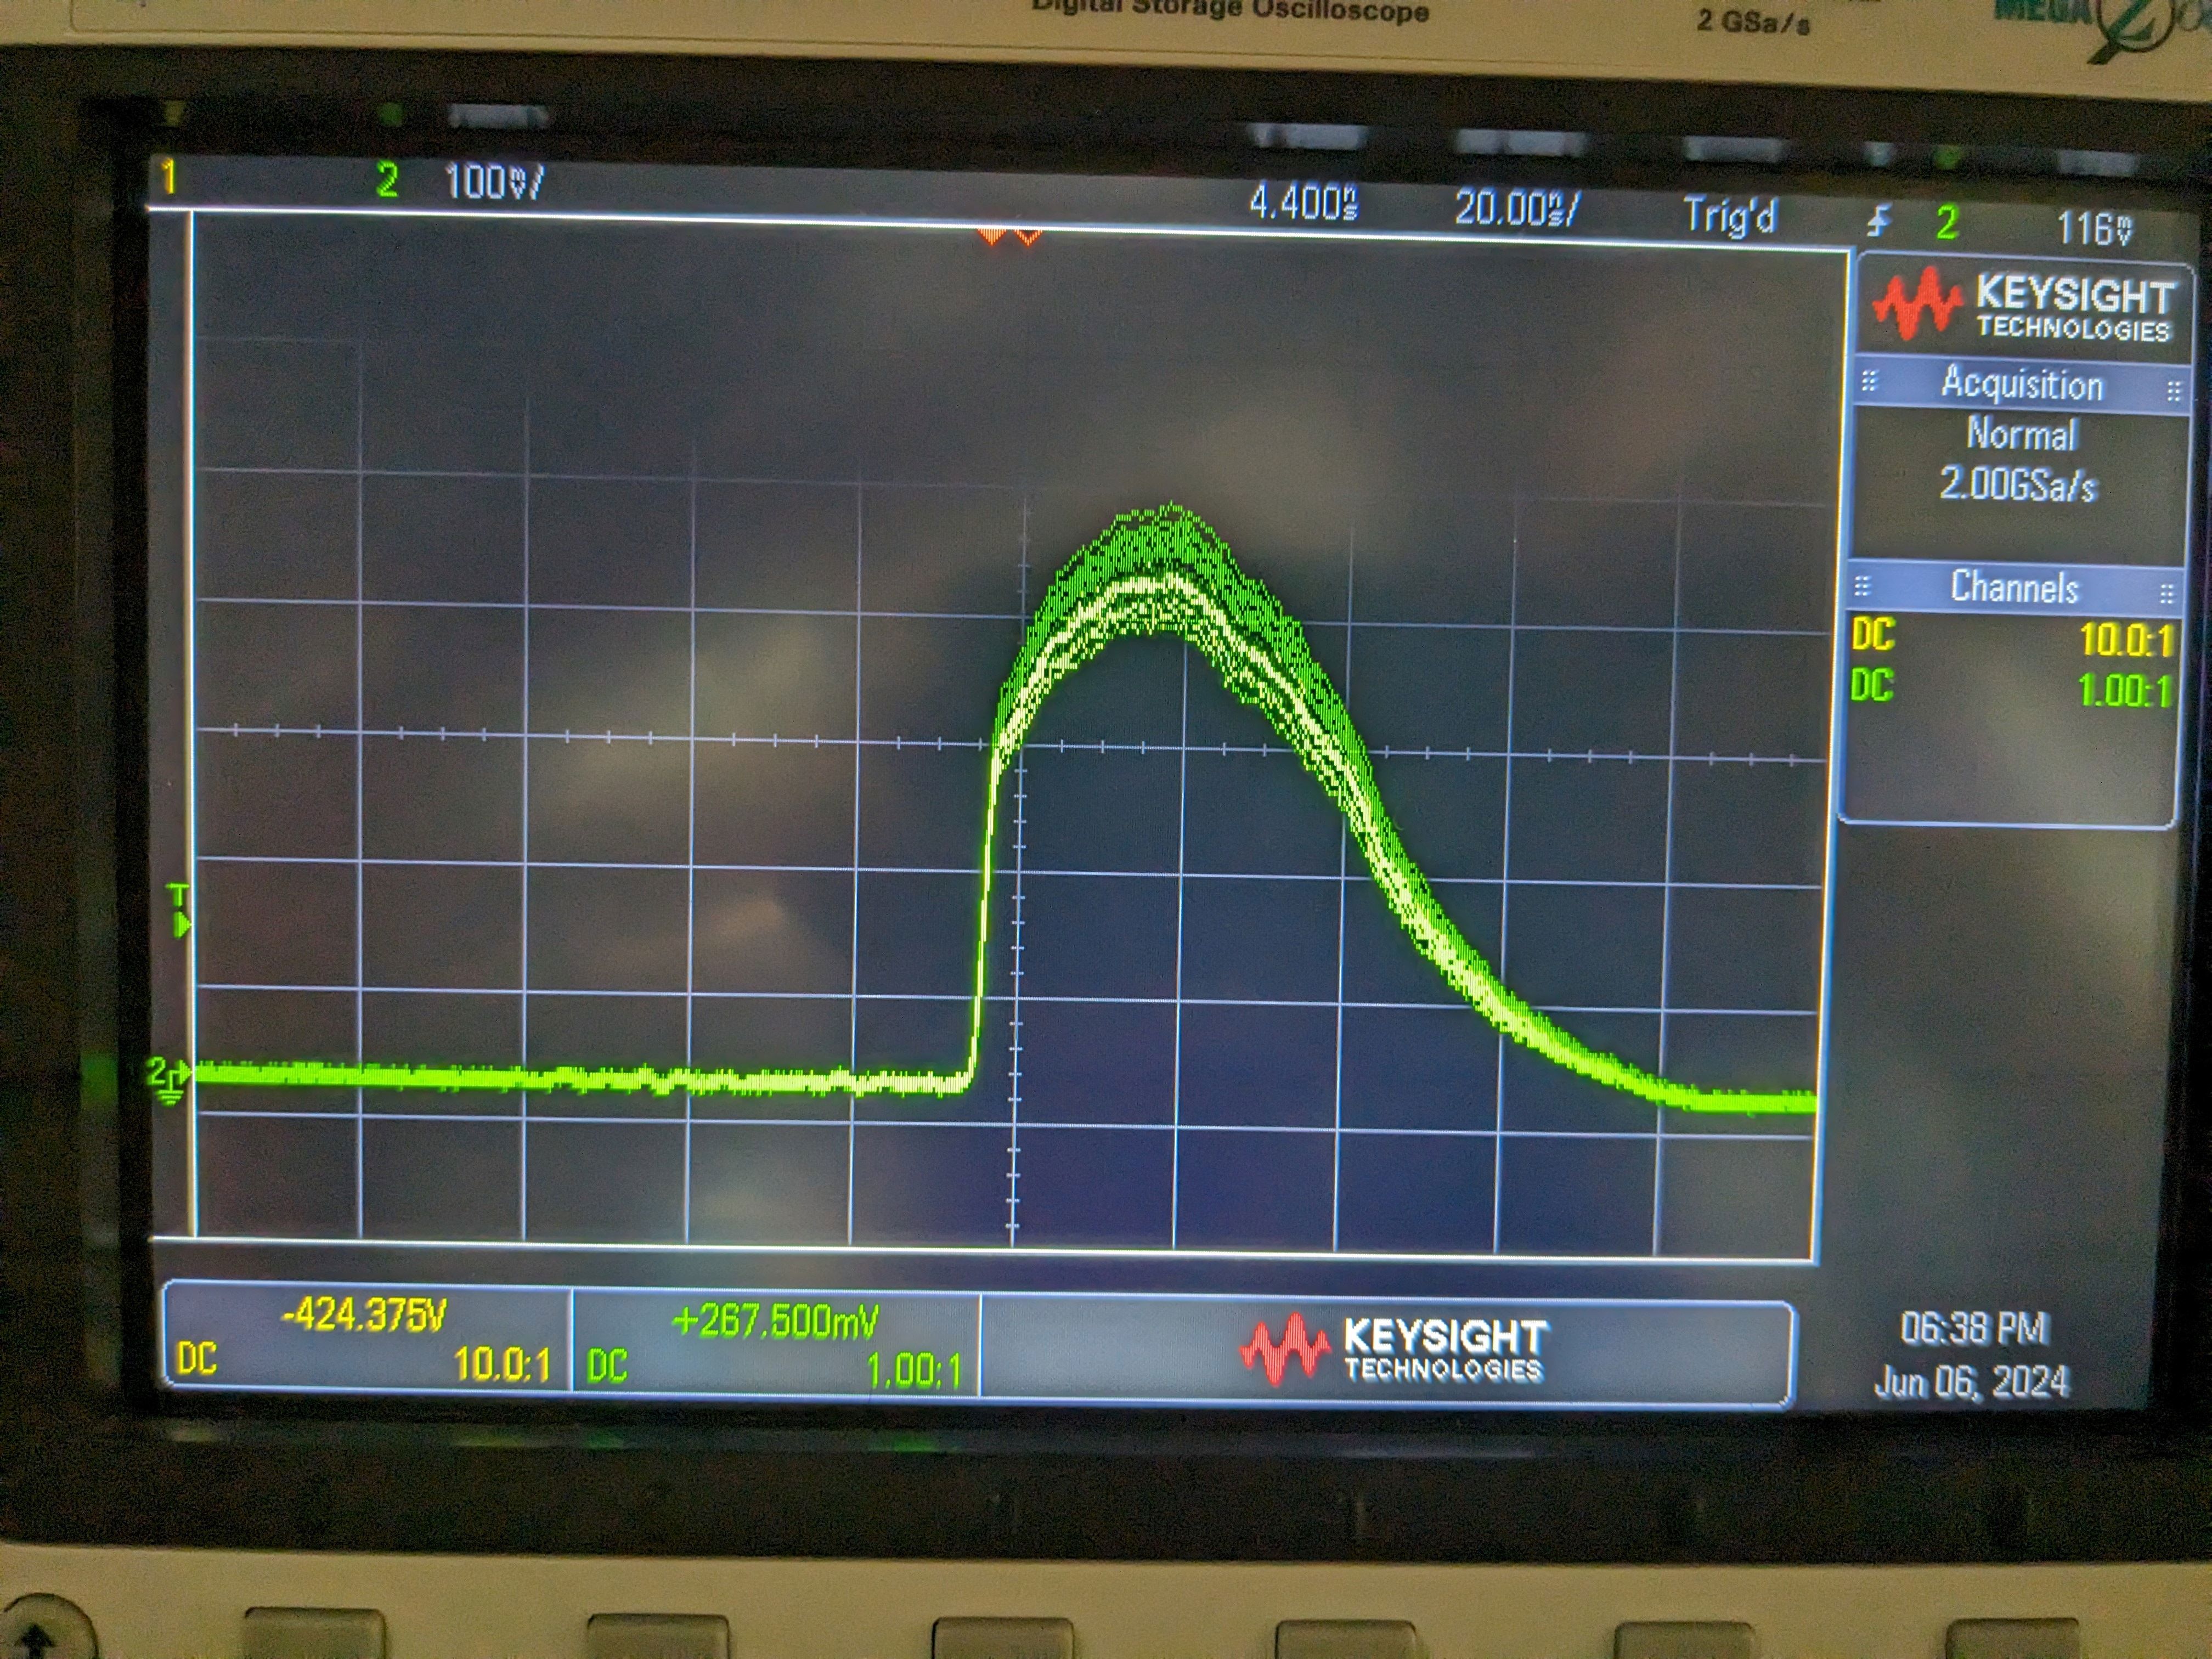
For the sake of clarity, here are four images of the o-scope trace at different intensities:

1: Barely visible signal (5mV/div) enter image description here 2: At the transition to this broadening effect (10mV/div) enter image description here 3: Well into the broadening regime (100mV/div) enter image description here 4: At saturation (1V/div) enter image description here
Thanks for any and all responses!

\$\endgroup\$
7
  • \$\begingroup\$ What kind of laser are you using as your source? Q-switched? Mode-locked? Are you varying the intensity between measurements via the laser pump? Or the attenuator? \$\endgroup\$
    – MOSFET
    Commented Jun 7 at 1:15
  • \$\begingroup\$ Just a comment on the setup. I would move the 50 ohm load closer to the detector. Use a feed through terminator like the CT2944C-50 .might help \$\endgroup\$
    – user319836
    Commented Jun 7 at 2:05
  • \$\begingroup\$ @RussellH The 50 ohms should be close to the scope to minimize reflections from the scope input back to the detector (resulting in non-flat frequency response to the scope). The current placement is correct, though a feedthrough, like you mentioned, would be ideal. \$\endgroup\$ Commented Jun 7 at 3:10
  • \$\begingroup\$ @MOSFET Ha ya those are some of the details I left out to keep the post readable. It's a bit complicated, but it's a modelocked titanium sapphire (~800nm) oscillator that is boosted with a regenerative chirped pulse amplifier and then sent through a multi-stage optical parametric amplfier with a difference-frequency-generation module to produce the LWIR pulses. The intensity is varied using the variable attenuator so that no changes to the spectrum or pulse-duration are made a variable. \$\endgroup\$ Commented Jun 11 at 23:29
  • \$\begingroup\$ @RussellH Good call, I was mainly just lazy and didn't want to move the scope over. :P \$\endgroup\$ Commented Jun 11 at 23:31

1 Answer 1

3
\$\begingroup\$

So to put the question succinctly: Is there a reason, from an electronics perspective, that I should see this premature temporal broadening of the signal as I increase the intensity? Or is it possibly an actual physical effect?

The DET410 datasheet specs that it will be linear to 1 mW of photocurrent with a 1 A/W photodiode, meaning it can supply 1 mA of current with good linearity. You're terminating into 50 ohms, so you get 50mV/mA. Scaling your plots, you have 0.4 mA, 1.2 mA, 9 mA, and 70 mA, so per the datasheet only the first plot is in the device's linear region. Too far beyond that the reverse bias voltage drops and the device goes into photovoltaic mode where it is much slower and the response is no longer linear.

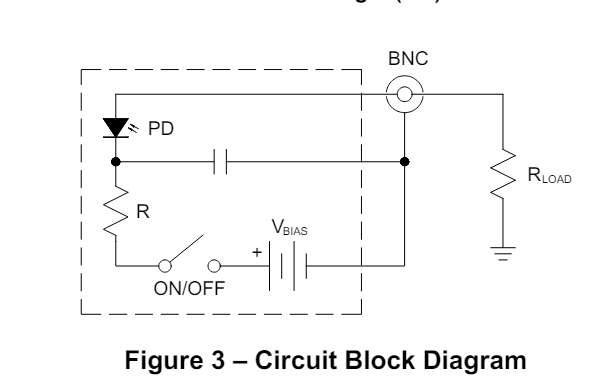
If you're surprised by the low saturation power, take a look at the circuit you're using (source: https://www.thorlabs.com/thorproduct.cfm?partnumber=DET410):

enter image description here

Note the series resistor. They don't spec a size, but I believe it is 1 KOhm. Even if it is not, the 12V coin cell battery will have a very large internal resistance, probably comparable or larger. When you try to pull 10+ mA through kOhms of resistance, the bias voltage drops to zero.

Solution

Don't use the DET410. Assuming you want a high bandwidth, get a benchtop lab power supply, put to 12V and use that as the current source. Add a 100nF ceramic capacitor as close as possible to the photodiode that connects +12 and GND (to stabilize the voltage seen by the photodiode) and set the current limit on the supply to 100 mA just so a short circuit doesn't start a fire. Now you can pull current until you saturate the photodiode or burn it up, whichever happens first.

\$\endgroup\$
4
  • \$\begingroup\$ This is extremely helpful! I didn't consider the linearity of the DET400 and it totally makes sense that dropping the bias voltage would cause the signal to start spreading temporally as it switches to photovoltaic mode. I'll report back once I've implemented your idea. Thanks again! Out of curiousity, I'd like to have a better intuition for these sorts of issues so do you have any recommended textbooks that deal with the practical aspects without just being a "technician-level" book? \$\endgroup\$ Commented Jun 11 at 23:35
  • \$\begingroup\$ @UltrashortGiraffe The Hamamatsu handbooks are a good reference for photodiode and shot noise. Not sure about books specifically. \$\endgroup\$ Commented Jun 12 at 0:58
  • \$\begingroup\$ @UltrashortGiraffe The capacitor needs to provide bypassing for the bias current, so it should be from the +12v to GND like in your original diagram for the DET410. By across the leads, I meant as close as physically possible to the photodiode leads to minimize inductance, but don't actually short them or you'll shunt all the high frequency current through the capacitor. I could see how my wording was confusing, so I'll edit it. \$\endgroup\$ Commented Jun 12 at 5:02
  • \$\begingroup\$ So I fixed it all up and honestly the signal response is rather poor. Lots of noise and very poor sensitivity. So instead of this, I've moved to using a transimpendence amplifier which holds the reverse bias voltage at a constant value regardless of the current being drawn which allows me to operate all the way to saturation. \$\endgroup\$ Commented Jun 18 at 17:48

Your Answer

By clicking “Post Your Answer”, you agree to our terms of service and acknowledge you have read our privacy policy.

Not the answer you're looking for? Browse other questions tagged or ask your own question.