0
\$\begingroup\$

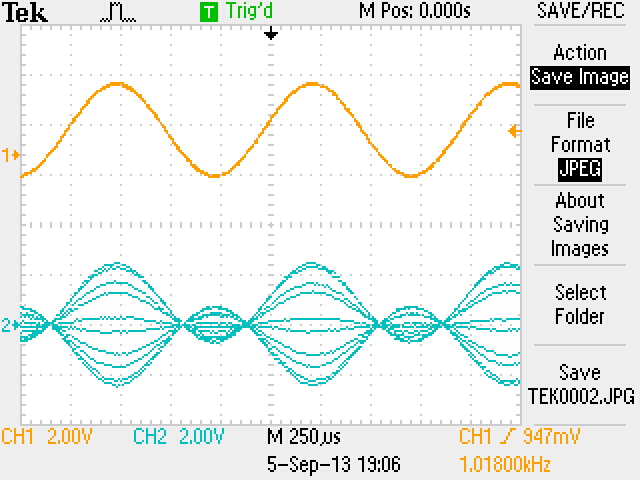
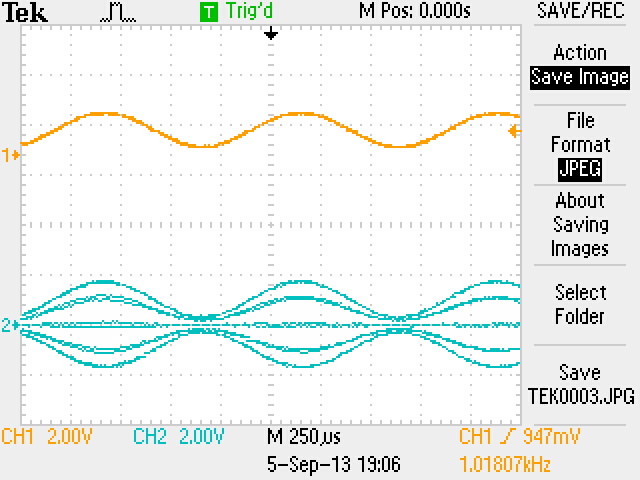
In my lab experiment (http://www.ele.uri.edu/courses/ele436/labs/expA2.pdf), My amplitude modulated wave is not displaying the vertical lines-the high frequency waves of carrier (as shown in accompanied figure).

top- message signal; bottom = modulated wave(here overmodulated)top- message signal;bottom = modulated wave(here overmodulated)
top- message signal;bottom = modulated wave(here m<1) top- message signal;bottom = modulated wave(here m<1) What could be the possible reason for it. Has flickering display of oscilloscope caused the problem?. How it can be corrected?
\$\endgroup\$
4
  • 1
    \$\begingroup\$ "the vertical line(as shown in accompanied figure)". What figure/vertical line are you referring to? \$\endgroup\$
    – jippie
    Commented Oct 17, 2013 at 18:35
  • \$\begingroup\$ Looks like the scope is in dot mode, displaying a dot for each sample, rather than the connecting lines in between them. Can you verify that? \$\endgroup\$
    – jippie
    Commented Oct 17, 2013 at 18:37
  • 1
    \$\begingroup\$ What "vertical line" are you talking about?? It looks like your carrier wave is too low in frequency. \$\endgroup\$ Commented Oct 17, 2013 at 18:37
  • \$\begingroup\$ Sorry for confusion, By 'vertical line' I meant the almost vertical lines of high frequency sinusodial or simply the curve. \$\endgroup\$
    – mohit
    Commented Oct 18, 2013 at 11:46

2 Answers 2

1
\$\begingroup\$

Your digital o-scope is aliasing the high frequency content of the modulated waveform. This is a common "feature" in digital oscillosopes.

You have the time base set to show the modulating signal (orange trace) and no problem here so far but the o-scope won't be sampling at its full bandwidth because it doesn't need to. If you turned the timebase up to run more quickly you'll get to a point when you start to see the carrier frequency in all its glory.

Here is a decent document that shows what happens and here's a little video you can watch.

\$\endgroup\$
2
  • \$\begingroup\$ Couldn't it be dot mode as explained by @jippie in above post? If only dots are displayed instead of connecting lines, the display might be the same. \$\endgroup\$
    – mohit
    Commented Oct 18, 2013 at 11:48
  • \$\begingroup\$ Is there a 'timebase' option on oscilloscope or it automatically adjusts?? \$\endgroup\$
    – mohit
    Commented Oct 18, 2013 at 11:54
0
\$\begingroup\$

I got myself a Hantek 200 MHz digital scope a couple of years ago and was very disappointed when I saw the mess it made of an amplitude-modulated signal (carrier freq around 25 MHz). It was just a mess. I've worked all my life with analogue scopes and they have no problem with AM signals of any frequency within their b/w. The Hantek had only a fairly small display memory and I think this the problem. A digital scope with a much bigger memory may be the answer, but there may still be a limit on how high the carrier freq could be before aliasing sets in.

\$\endgroup\$

Your Answer

By clicking “Post Your Answer”, you agree to our terms of service and acknowledge you have read our privacy policy.

Not the answer you're looking for? Browse other questions tagged or ask your own question.