1
\$\begingroup\$

I have been given a 2nd order transfer function in continuous time domain and been asked to design a feedback regulator and an observer for it.

The initial closed-loop system's transfer function is: \$\frac{{\;\;\;\;\;\;100s + 500}}{{{s^2} + 105s + 506}} % MathType!MTEF!2!1!+- % feaagKart1ev2aqatCvAUfeBSjuyZL2yd9gzLbvyNv2CaerbuLwBLn % hiov2DGi1BTfMBaeXatLxBI9gBaerbd9wDYLwzYbItLDharqqtubsr % 4rNCHbGeaGqiVu0Je9sqqrpepC0xbbL8F4rqqrFfpeea0xe9Lq-Jc9 % vqaqpepm0xbba9pwe9Q8fs0-yqaqpepae9pg0FirpepeKkFr0xfr-x % fr-xb9adbaqaaeGaciGaaiaabeqaamaabaabaaGcbaWaaSaaaeaaca % aMe8UaaGjbVlaaysW7caaMe8UaaGjbVlaaysW7caaIXaGaaGimaiaa % icdacaWGZbGaey4kaSIaaGynaiaaicdacaaIWaaabaGaam4CamaaCa % aaleqabaGaaGOmaaaakiabgUcaRiaaigdacaaIWaGaaGynaiaadoha % cqGHRaWkcaaI1aGaaGimaiaaiAdaaaaaaa!4EA5! \$

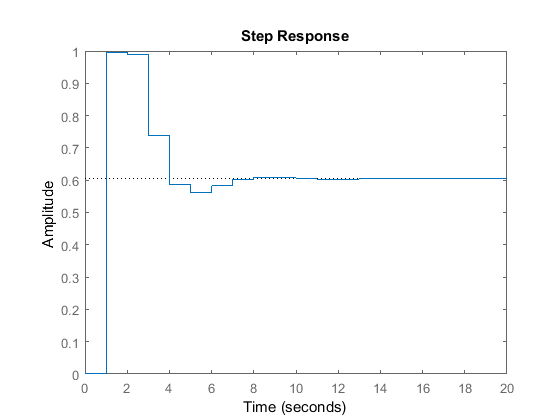
To discretize the system, I can select whatever sampling interval I like. However, selecting a different sampling interval, will change overal system's response significantly. For instance, this is my system's response with sampling interval T=0.1 sec to a unit step input:
enter image description here

The overal system's transfer function is (including feedback regulator and deadbeat observer):

enter image description here

~~~~~~~~~~~~~~~~~~~~~~~~~~~~~~~~~~~~~~~~~~~

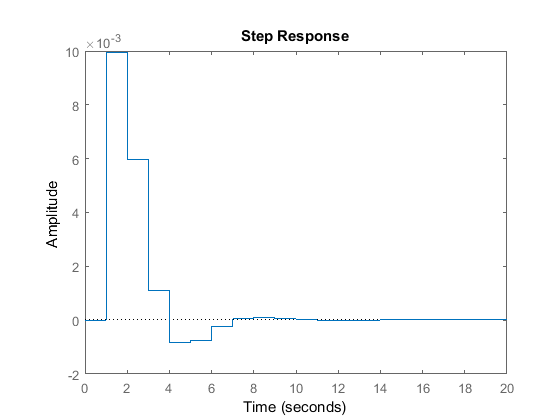
Compared to this one with T=0.0001:
enter image description here

The overal system's transfer function is: enter image description here

My question is how to justify the differences in responses.

(Above plots are simply step responses to mentioned transfer functions) Regards

\$\endgroup\$
12
  • \$\begingroup\$ This seems odd to me. You are sampling your continuous time signal after your system, is it right? Can you also add the continuous time response? \$\endgroup\$ Commented May 27, 2015 at 7:45
  • \$\begingroup\$ Can you give us the system and the comand you are using to discretize? \$\endgroup\$
    – MdxBhmt
    Commented May 27, 2015 at 7:47
  • 1
    \$\begingroup\$ The difference between the steady state values at 20 seconds suggests to me that these aren't really showing everything that's going on. If the equations really were the same I'd have expected them to have the same steady state error, with the same given input. Somewhere, the inputs or the system is different, or steady state hasn't actually been achieved in one or the other. \$\endgroup\$
    – user39962
    Commented May 27, 2015 at 8:01
  • 1
    \$\begingroup\$ You could get this with under-sampling i.e. aliasing. Although the top graph looks like a low pass filter, it could be a high pass filter (like the bottom graph) but its low sampling rate could be exactly under-sampling a signal of the right frequency and producing aliasing i.e. a dc offset. \$\endgroup\$
    – Andy aka
    Commented May 27, 2015 at 8:18
  • 1
    \$\begingroup\$ Are you placing poles after you discretize? That may be your problem: poles of continuos systems are not the same for discrete - as example, continuous poles are stable with real part negative, discrete poles are stable with norm less than 1. Even worse, continuous ->discrete pole placement is totally dependent on T, so that may explain the diference on outputs. You can use step directly on the system given by c2d. Compare those two before anything else. \$\endgroup\$
    – MdxBhmt
    Commented May 27, 2015 at 8:24

1 Answer 1

1
\$\begingroup\$

Pole performance on discrete systems are dependent on T - the timestep.

You want the following:

$$S_i = \frac{ Z_i-1}{T} = \frac{Z_i'-1}{T'}$$

If you don't adjust accordingly, the step response will wildly change, as seen in your case, a second order system became a differentiator (with dominant zero)

If you don't adjust Z_i' for T', the equivalent pole placement is

$$S_i'=\frac{Z_i'-1}{T'}=\frac{Z_i-1}{T'}=\frac{T}{T'}S_i$$

Since T' is made smaller, T/T' makes S_i' bigger - thus faster.

Since the zeroes are unchanged, the poles are relatively faster than the zeroes, meaning they are less dominant. That's why the system approach a differentiator.

\$\endgroup\$
2
  • \$\begingroup\$ Thanks for the answer. I am not quite sure if I understood your explanation correctly or not. First, can you please clarify how did you work out above equations? what are S_i and Z_i parameters? Moreover, as far as I can say from your answer, such major changes in two step responses with two significantly different sampling intervals are normal due to your rational. But nothing wrong with selecting T=0.0001 for my design. Right? \$\endgroup\$
    – Bababarghi
    Commented May 29, 2015 at 0:16
  • 1
    \$\begingroup\$ That's right. S_i is the equivalent pole on continuous system. Z_i is the discrete pole. The formula above is the 'forward aproximation' of the S->Z transform. digital.ni.com/public.nsf/allkb/… They come from manipulating Z=e^(sT) \$\endgroup\$
    – MdxBhmt
    Commented May 29, 2015 at 12:51

Your Answer

By clicking “Post Your Answer”, you agree to our terms of service and acknowledge you have read our privacy policy.

Not the answer you're looking for? Browse other questions tagged or ask your own question.