added JB_stage as example of transient response
Source Link
analogsystemsrf
  • 35k
  • 2
  • 20
  • 48

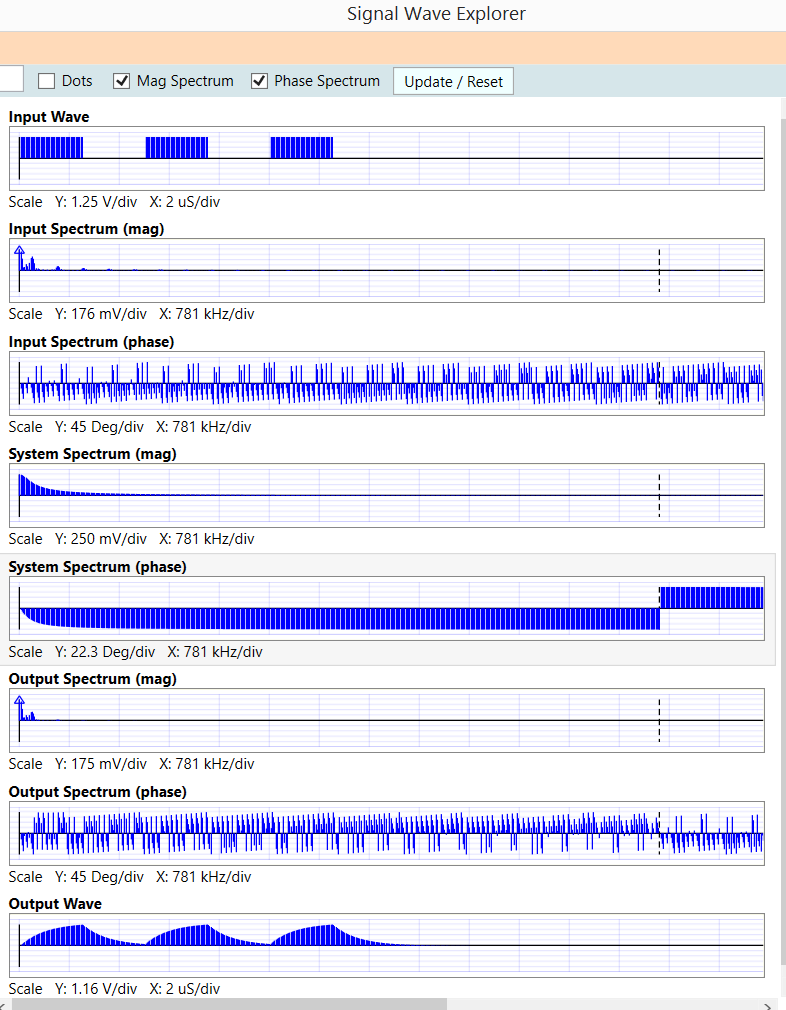
Here is Signal Wave Explorer, using FFT, to model 3 pulses thru a LPF. On right side of the plots is a dotted vertical line, the Nyquist frequency. In the Mag/Phase that is the mirroring frequency, indeed shown here.

[ We are interested in very accurate modeling of the SETTLING of opamp responses, to the 16 and 20 and 24 bit levels. Thus far, in SWE, with 512,000 samples, we easily reach the 20 bit level. With larger memory allocation, we expect to reach 24+ bits. The built-in example "JB stage", shown at end of this answer, illustrates typical problems of settling. ]

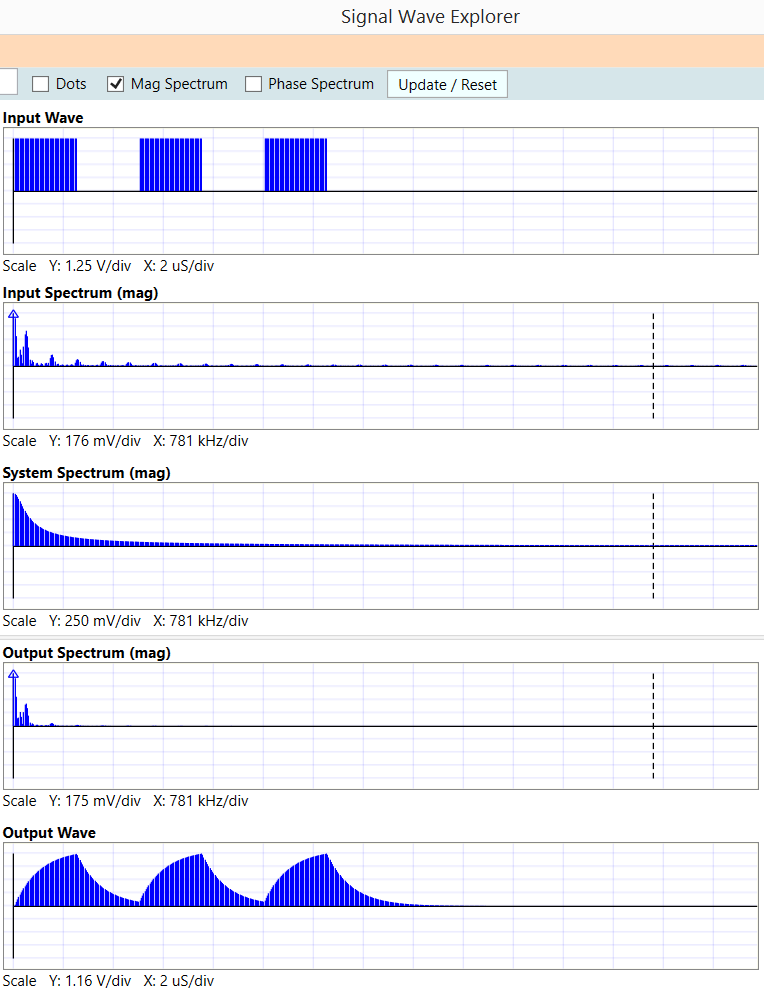
Shown below these 8 plots is screenshot with just InputWaveform, Magnitude plots, and OutputWaveform. Examine the OutputWaveform carefully, particularly the 3rd output pulse, and you'll see that final decay to zero amplitude. The first 2 pulses are not allowed enough time to decay to zero amplitude.

Thus we have used the FFT to fully capture the transient behavior.

enter image description here

And now without the Phase plots. In the InputSpectrum, you see the sin(x)/x components of the squarewave, with amplitudes decaying as 1/Harmonic#. The tool --SWE--- simply multiplies this InputSpectrum with the SystemSpectrum, producing the OutputSpectrum; magnitudes are multiplied; phases are added. Then OutputSpectrum undergoes InverseFFT, to produce the OutputWave.

enter image description here

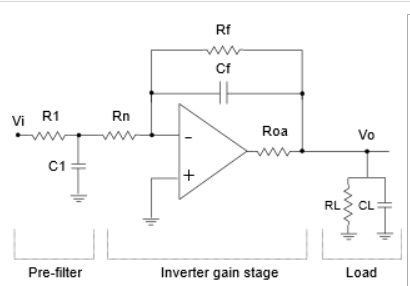
Here is the JB_stage example.

enter image description here

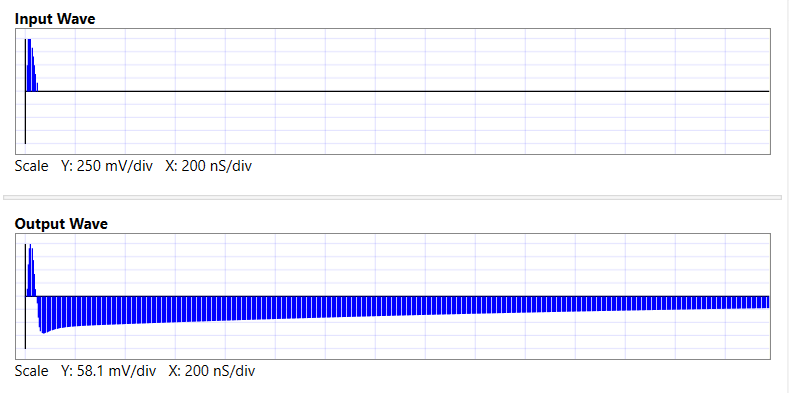
Here is output waveform of JB_stage, with NO input filtering (C1 is not active); notice the initial pulse is NONINVERTING. The input edge blasts right through the feedback capacitor.

enter image description here

Here is Signal Wave Explorer, using FFT, to model 3 pulses thru a LPF. On right side of the plots is a dotted vertical line, the Nyquist frequency. In the Mag/Phase that is the mirroring frequency, indeed shown here.

Shown below these 8 plots is screenshot with just InputWaveform, Magnitude plots, and OutputWaveform. Examine the OutputWaveform carefully, particularly the 3rd output pulse, and you'll see that final decay to zero amplitude. The first 2 pulses are not allowed enough time to decay to zero amplitude.

Thus we have used the FFT to fully capture the transient behavior.

enter image description here

And now without the Phase plots. In the InputSpectrum, you see the sin(x)/x components of the squarewave, with amplitudes decaying as 1/Harmonic#. The tool --SWE--- simply multiplies this InputSpectrum with the SystemSpectrum, producing the OutputSpectrum; magnitudes are multiplied; phases are added. Then OutputSpectrum undergoes InverseFFT, to produce the OutputWave.

enter image description here

Here is Signal Wave Explorer, using FFT, to model 3 pulses thru a LPF. On right side of the plots is a dotted vertical line, the Nyquist frequency. In the Mag/Phase that is the mirroring frequency, indeed shown here.

[ We are interested in very accurate modeling of the SETTLING of opamp responses, to the 16 and 20 and 24 bit levels. Thus far, in SWE, with 512,000 samples, we easily reach the 20 bit level. With larger memory allocation, we expect to reach 24+ bits. The built-in example "JB stage", shown at end of this answer, illustrates typical problems of settling. ]

Shown below these 8 plots is screenshot with just InputWaveform, Magnitude plots, and OutputWaveform. Examine the OutputWaveform carefully, particularly the 3rd output pulse, and you'll see that final decay to zero amplitude. The first 2 pulses are not allowed enough time to decay to zero amplitude.

Thus we have used the FFT to fully capture the transient behavior.

enter image description here

And now without the Phase plots. In the InputSpectrum, you see the sin(x)/x components of the squarewave, with amplitudes decaying as 1/Harmonic#. The tool --SWE--- simply multiplies this InputSpectrum with the SystemSpectrum, producing the OutputSpectrum; magnitudes are multiplied; phases are added. Then OutputSpectrum undergoes InverseFFT, to produce the OutputWave.

enter image description here

Here is the JB_stage example.

enter image description here

Here is output waveform of JB_stage, with NO input filtering (C1 is not active); notice the initial pulse is NONINVERTING. The input edge blasts right through the feedback capacitor.
enter image description here

added 984 characters in body
Source Link
analogsystemsrf
  • 35k
  • 2
  • 20
  • 48

Here is Signal Wave Explorer, using FFT, to model 3 pulses thru a LPF. On right side of the plots is a dotted vertical line, the Nyquist frequency. In the Mag/Phase that is the mirroring frequency, indeed shown here.

Shown below these 8 plots is screenshot with just InputWaveform, Magnitude plots, and OutputWaveform. Examine the OutputWaveform carefully, particularly the 3rd output pulse, and you'll see that final decay to zero amplitude. The first 2 pulses are not allowed enough time to decay to zero amplitude.

Thus we have used the FFT to fully capture the transient behavior.

enter image description here

And now without the Phase plots. In the InputSpectrum, you see the sin(x)/x components of the squarewave, with amplitudes decaying as 1/Harmonic#. The tool --SWE--- simply multiplies this InputSpectrum with the SystemSpectrum, producing the OutputSpectrum; magnitudes are multiplied; phases are added. Then OutputSpectrum undergoes InverseFFT, to produce the OutputWave.

enter image description here

Here is Signal Wave Explorer, using FFT, to model 3 pulses thru a LPF

enter image description here

Here is Signal Wave Explorer, using FFT, to model 3 pulses thru a LPF. On right side of the plots is a dotted vertical line, the Nyquist frequency. In the Mag/Phase that is the mirroring frequency, indeed shown here.

Shown below these 8 plots is screenshot with just InputWaveform, Magnitude plots, and OutputWaveform. Examine the OutputWaveform carefully, particularly the 3rd output pulse, and you'll see that final decay to zero amplitude. The first 2 pulses are not allowed enough time to decay to zero amplitude.

Thus we have used the FFT to fully capture the transient behavior.

enter image description here

And now without the Phase plots. In the InputSpectrum, you see the sin(x)/x components of the squarewave, with amplitudes decaying as 1/Harmonic#. The tool --SWE--- simply multiplies this InputSpectrum with the SystemSpectrum, producing the OutputSpectrum; magnitudes are multiplied; phases are added. Then OutputSpectrum undergoes InverseFFT, to produce the OutputWave.

enter image description here

Source Link
analogsystemsrf
  • 35k
  • 2
  • 20
  • 48

Here is Signal Wave Explorer, using FFT, to model 3 pulses thru a LPF

enter image description here