added 258 characters in body
Source Link
AgentS
  • 591
  • 7
  • 18

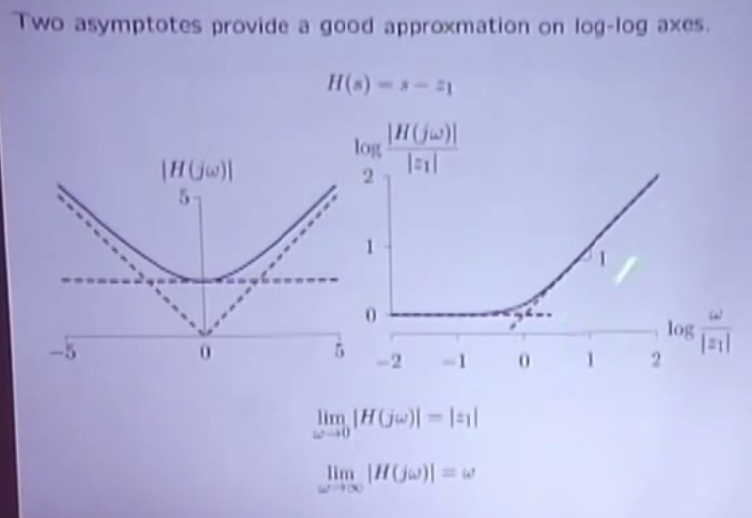
In below picture there are two graphs representing the function \$H(s) = s-z_1\$ (assume \$z_1=2\$ is a constant).

The left graph has \$\omega\$ on x axis and \$\|H(j\omega)\|\$ on y axis.
The right graph has \$\log\dfrac{\omega}{\|z_1\|}\$ on x axis and \$\log\dfrac{\| H(j\omega)\| }{\|z_1\|}\$ on y axis.

I completely understand the left graph. I don't understand how they got the right graph. I get why \$\|H(j\omega)\|\$ approaches \$\|z_1\|\$ as \$\omega \to 0\$, and I get why \$\|H(j\omega)\|\$ approaches \$\omega\$ as \$\omega \to \infty\$. But what happened to the graph for \$\omega \lt 0\$ ? I don't see it in the right graph ? enter image description here
EDIT : Kindly bear with the poor quality screenshot. Looks MIT folks have compressed too much these videos... Here is the video from which I took this screenshot

In below picture there are two graphs representing the function \$H(s) = s-z_1\$ (assume \$z_1=2\$ is a constant).

The left graph has \$\omega\$ on x axis and \$\|H(j\omega)\|\$ on y axis.
The right graph has \$\log\dfrac{\omega}{\|z_1\|}\$ on x axis and \$\log\dfrac{\| H(j\omega)\| }{\|z_1\|}\$ on y axis.

I completely understand the left graph. I don't understand how they got the right graph. I get why \$\|H(j\omega)\|\$ approaches \$\|z_1\|\$ as \$\omega \to 0\$, and I get why \$\|H(j\omega)\|\$ approaches \$\omega\$ as \$\omega \to \infty\$. But what happened to the graph for \$\omega \lt 0\$ ? I don't see it in the right graph ? enter image description here

EDIT : Kindly bear with the poor quality screenshot. Looks MIT folks have compressed too much these videos... Here is the video from which I took this screenshot

Source Link
AgentS
  • 591
  • 7
  • 18

Understanding log-log axes

In below picture there are two graphs representing the function \$H(s) = s-z_1\$ (assume \$z_1=2\$ is a constant).

The left graph has \$\omega\$ on x axis and \$\|H(j\omega)\|\$ on y axis.
The right graph has \$\log\dfrac{\omega}{\|z_1\|}\$ on x axis and \$\log\dfrac{\| H(j\omega)\| }{\|z_1\|}\$ on y axis.

I completely understand the left graph. I don't understand how they got the right graph. I get why \$\|H(j\omega)\|\$ approaches \$\|z_1\|\$ as \$\omega \to 0\$, and I get why \$\|H(j\omega)\|\$ approaches \$\omega\$ as \$\omega \to \infty\$. But what happened to the graph for \$\omega \lt 0\$ ? I don't see it in the right graph ? enter image description here