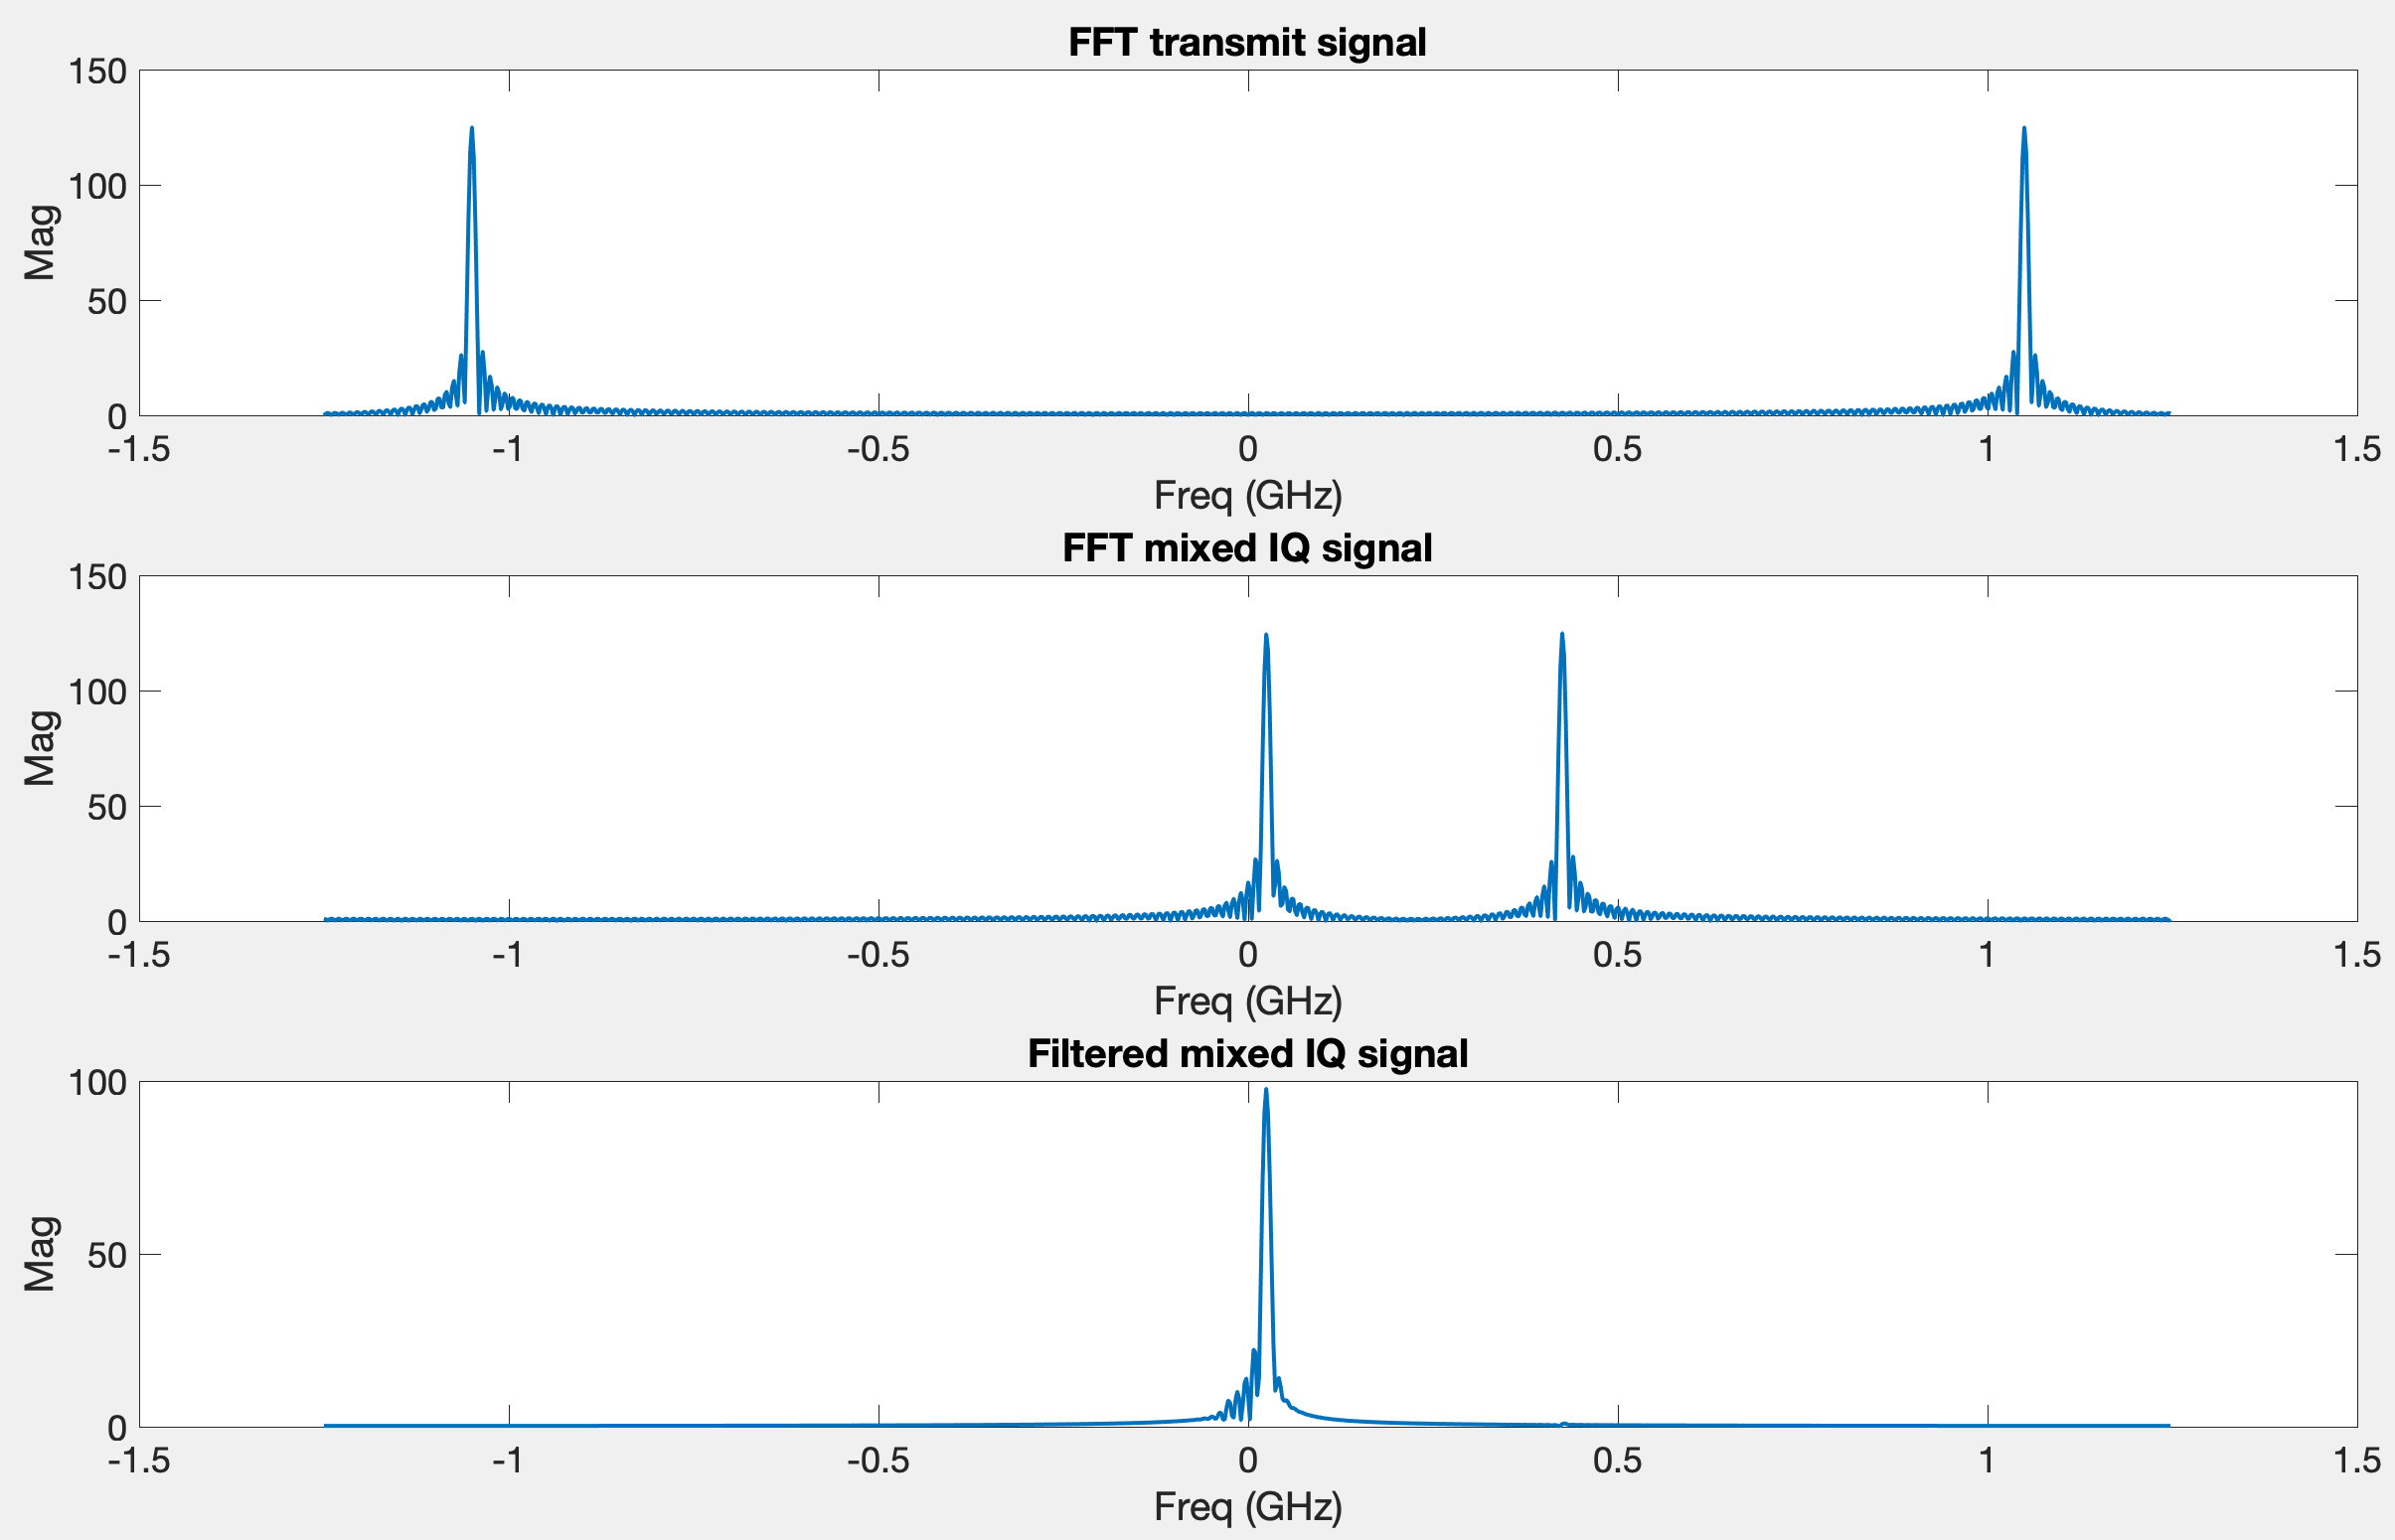
Likewise, the FFTs of the transmit signal, complex mixed signal, and filtered complex mixed signal are shown below. Note that the transmit signal, which is real, has a symmetric FFT, while the complex mixed signals are asymmetric in the frequency domain. Before the filter, there is a peak at 0.4 GHz. This peak is really at a higher frequency, but I am undersampling, causing it to alias to 0.4 GHz.
Likewise, the FFTs of the transmit signal, complex mixed signal, and filtered complex mixed signal are shown below. Note that the transmit signal, which is real, has a symmetric FFT, while the complex mixed signals are asymmetric in the frequency domain. Before the filter, there is a peak at 0.4 GHz. This peak is really at a higher frequency, but I am undersampling, causing it to alias to 0.4 GHz.
Yes, you can use an I/Q system to do FSK. The quadrature receiver can be beneficial, especially in a setup like the one described by @user253751 where the LO frequency is halfway between the bit 1 frequency and the bit 0 frequency. \$ f_1 = \$ frequency for bit 1, \$ f_0 = \$frequency bit 0 and \$ f_{LO} = \dfrac{f_1+f_0}{2} = \$ frequency local oscillator. Below I attached a schematic for an IQ receiver
The receiver has a few parts. Primarily there is the mixer which (ideally) multiplies the LO and the received signal together. Using the product rule for sinusoids gives that. The output signal for the 0-bit and 1-bit cases are going to be
\$ cos(2 \pi f_1t) cos(2 \pi f_{LO} t) = \dfrac{1}{2} [cos(2 \pi (f_1-f_{LO}) t) + cos(2 \pi (f_1+f_{LO})t)] \$
\$ cos(2 \pi f_0t) cos(2 \pi f_{LO} t) = \dfrac{1}{2} [cos(2 \pi (f_0-f_{LO}) t) + cos(2 \pi (f_0+f_{LO})t)] \$ Usually following the mixing of the signal, there is an LPF to remove the high-frequency components, which are \$ cos(2 \pi (f_0+f_{LO})t) \$ and \$ cos(2 \pi (f_1+f_{LO})t) \$
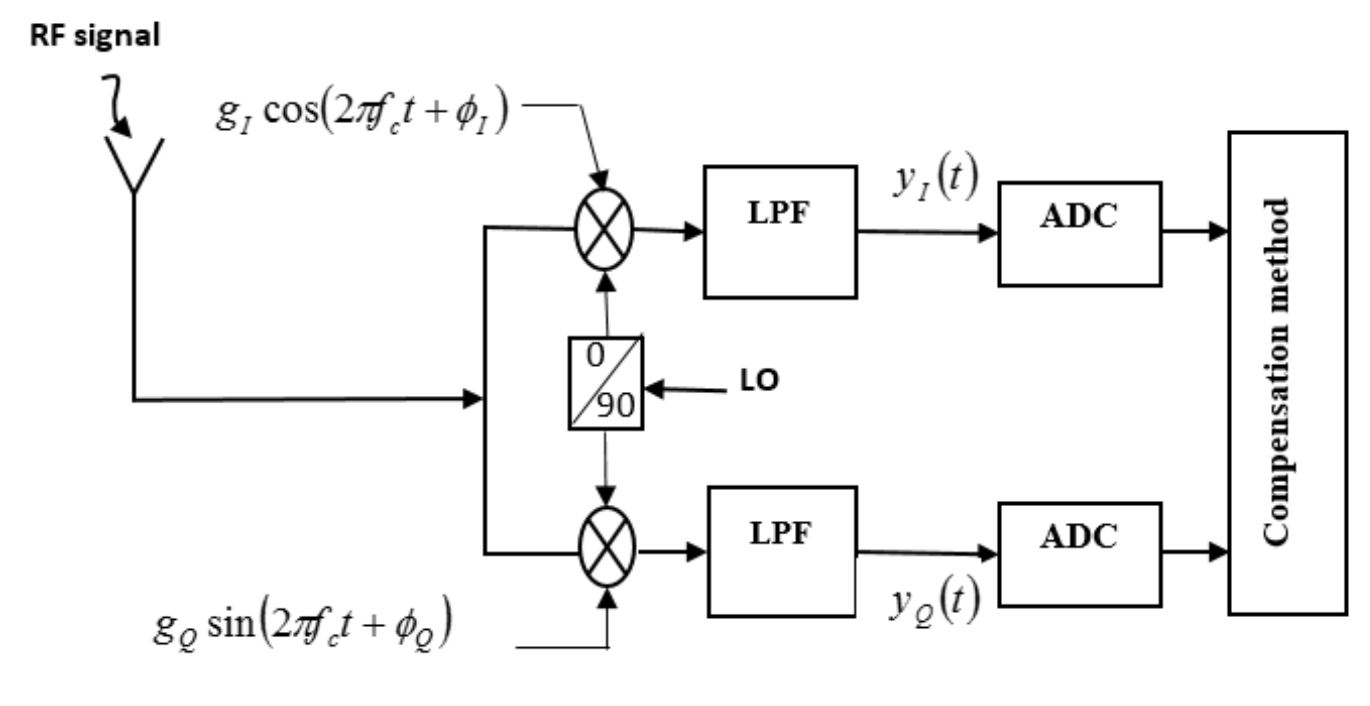
So based on the image schematic of the IQ receiver belo,w the received signal at the \$y_I(t) \$ is
\$ y_I(t) = \begin{cases} \dfrac{1}{2} cos(2 \pi (f_1-f_{LO}) t) & \text{for bit 1} \\ \dfrac{1}{2} cos(2 \pi (f_0-f_{LO}) t) & \text{for bit 0} \end{cases} \$
There is a problem with this because of how \$ f_1 f_0, f_{LO} \$ were chosen. In the scenario above, define
\$ f_{b1} = (f_1-f_{LO}) \$ \$ f_{b0} = (f_0-f_{LO}) \$
Then based on the definitions for \$ f_1 f_0, f_{LO} \$ I can say that \$ f_{b1} = - f_{b0} \$. Furthermore, since we are measuring real signals, the Fourier transform of these signals will have symmetric and identical magnitude spectrums in the Fourier domain.
This is where IQ sampling comes in. It allows us to differentiate these signals by essentially making them complex signals. This is done by adding a phase shift of 90° before mixing in the quadrature (Q) channel. Following the same analysis as above, it is possible to derive that.
\$ y_Q(t) = \begin{cases} \dfrac{1}{2} cos(2 \pi (f_1-f_{LO}) t) = \dfrac{1}{2} cos(2 \pi (f_{b1}-\dfrac{\pi}{2}) t) = \dfrac{1}{2} sin( 2\pi f_{b1} t) & \text{for bit 1} \\ \dfrac{1}{2} cos(2 \pi (f_0-f_{LO}) t)= \dfrac{1}{2} cos(2 \pi (f_{b0}-\dfrac{\pi}{2}) t) = \dfrac{1}{2} sin( 2\pi f_{b0} t) & \text{for bit 0} \end{cases} \$
Now if I define my final signal as \$ y_1(t) = y_{I1}(t)+jy_{Q1}(t) = e^{j 2\pi f_{b1} t} \$. Now because my signal is complex, I can differentiate \$ f_{b1} \$ and \$ f_{b0} \$ in the frequency domain. From this point on, I can do my matched filtering/detection however I want.
To help illustrate the entire process, I wrote a MATLAB script to detect if a 0 or 1 is being transmitted using an IQ receiver.
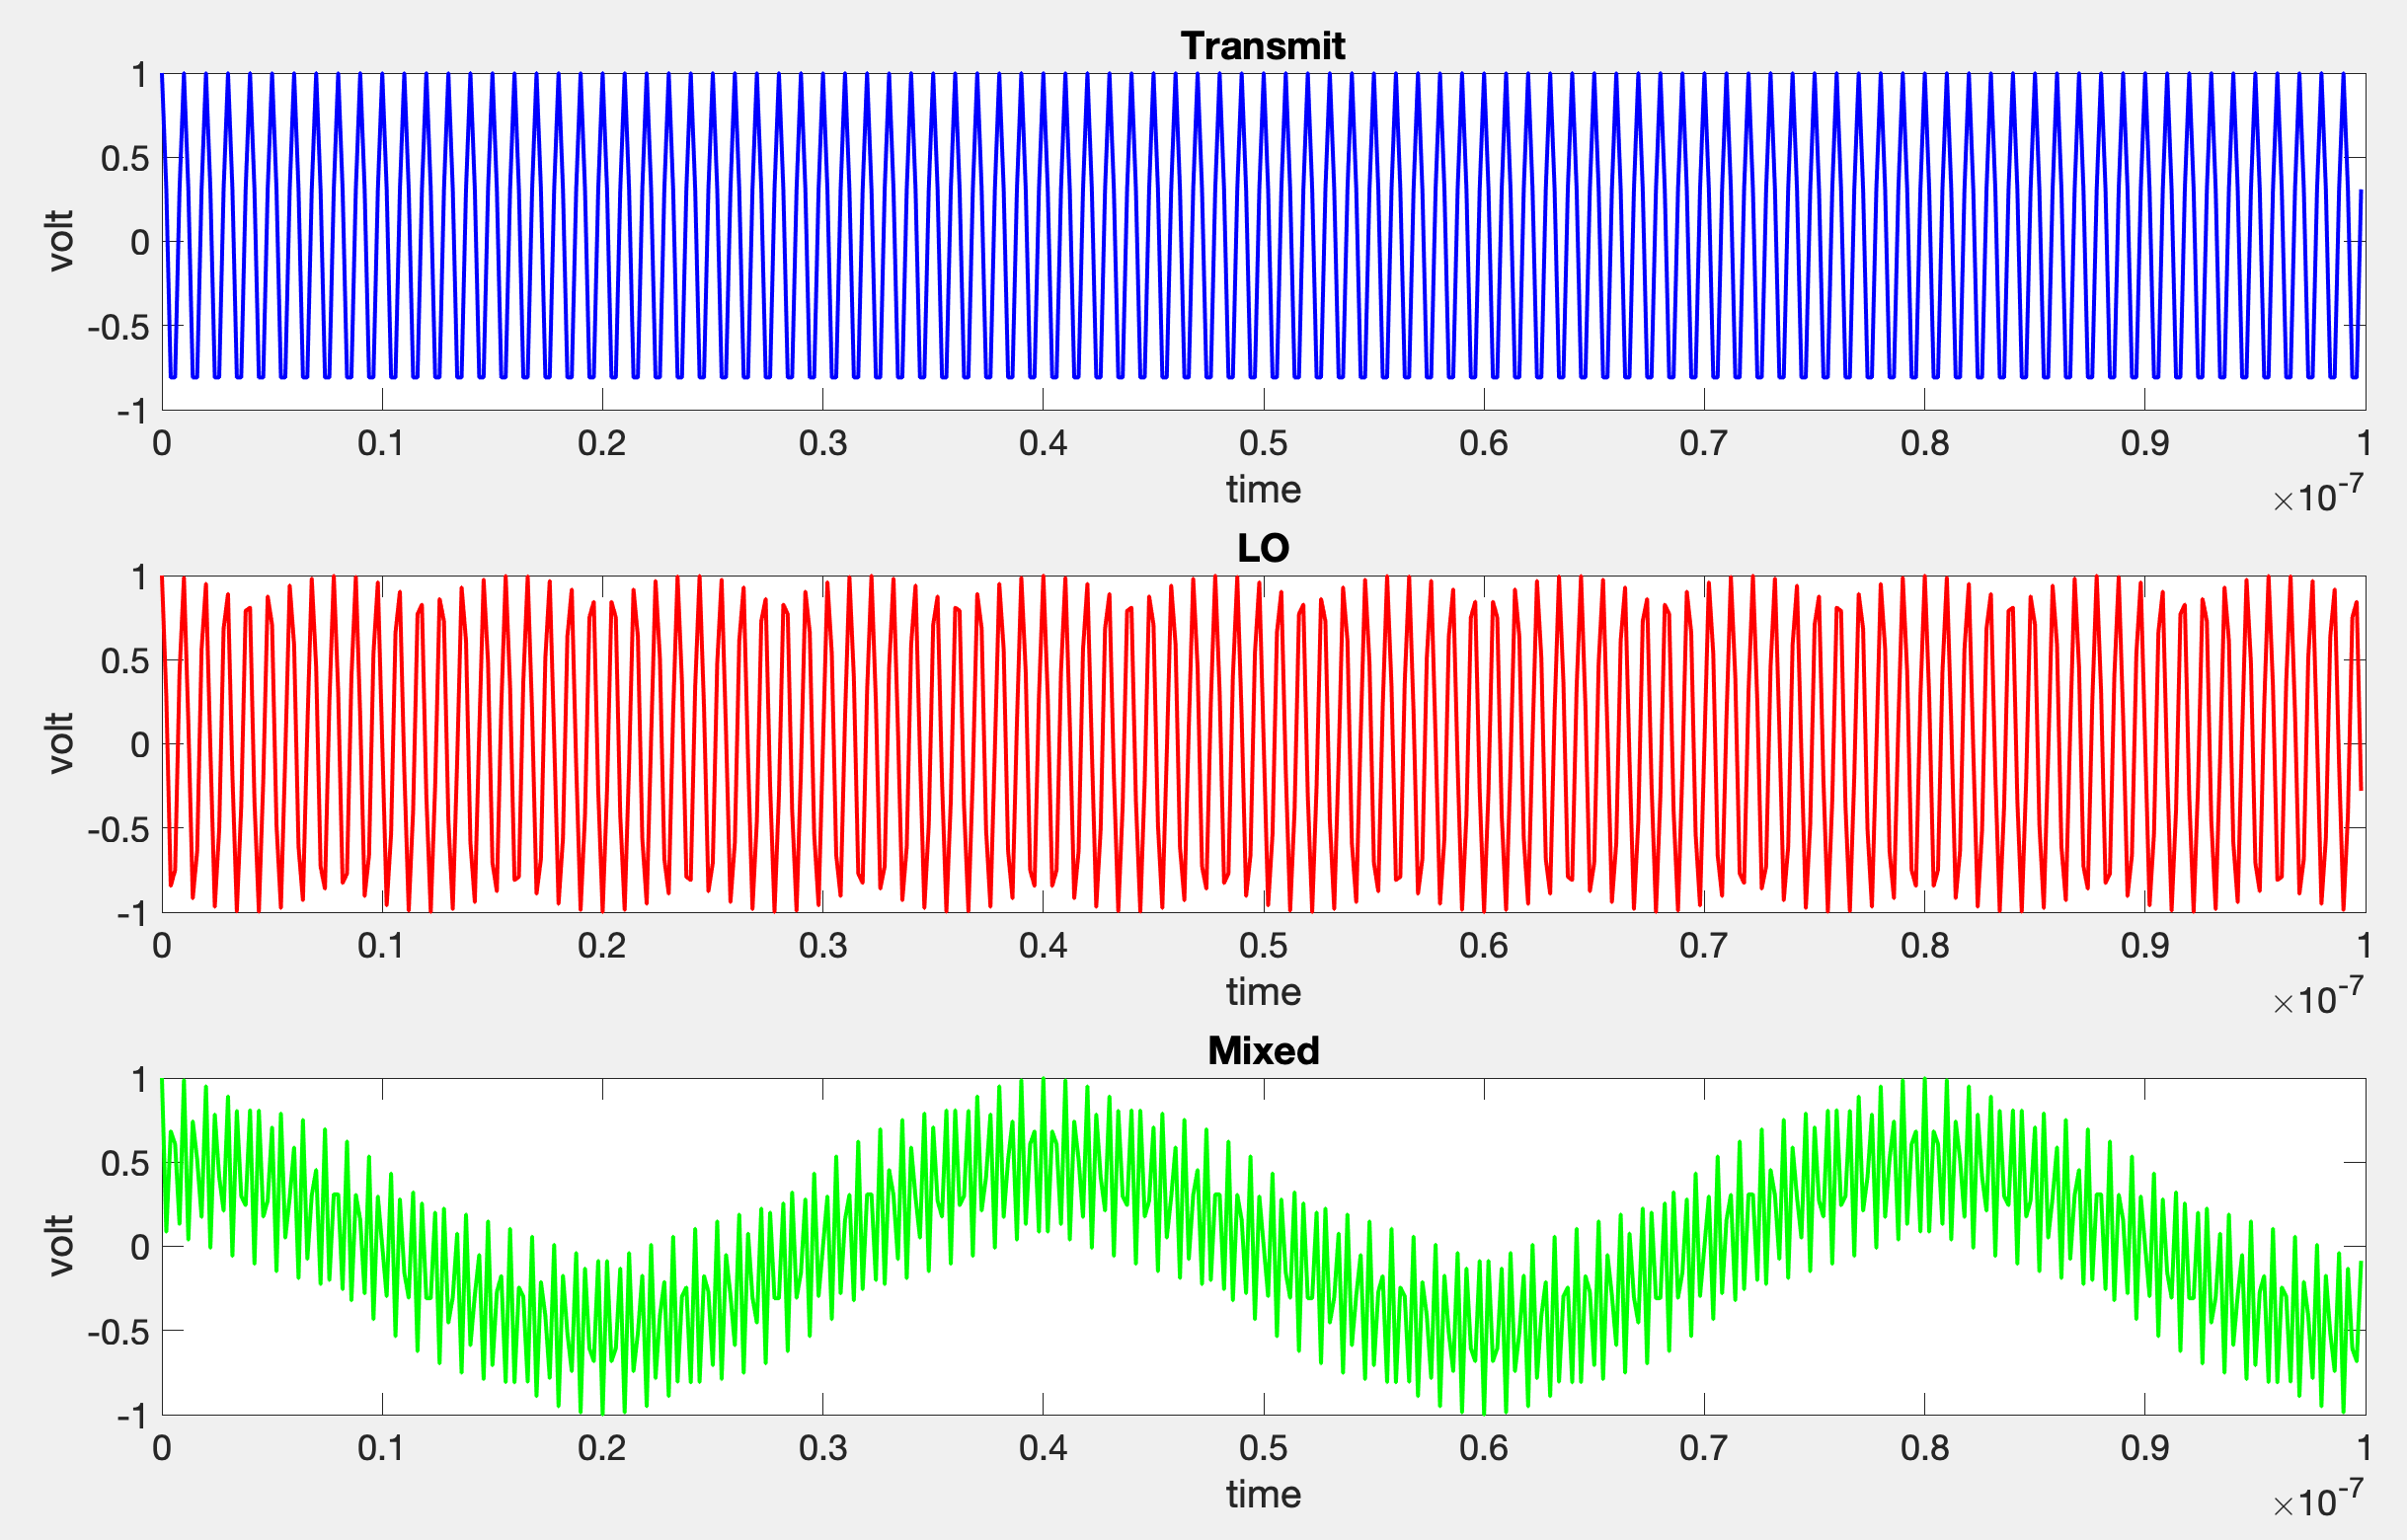
First is an image of the transmit signal for bit 1, along with the local oscillator and mixed signals for bit 1. Notice how in the mixed signal, there are fast oscillations from the summation of the local oscillator and bit 1 frequencies and slow oscillations from the difference in the local oscillator and bit 1 frequencies.
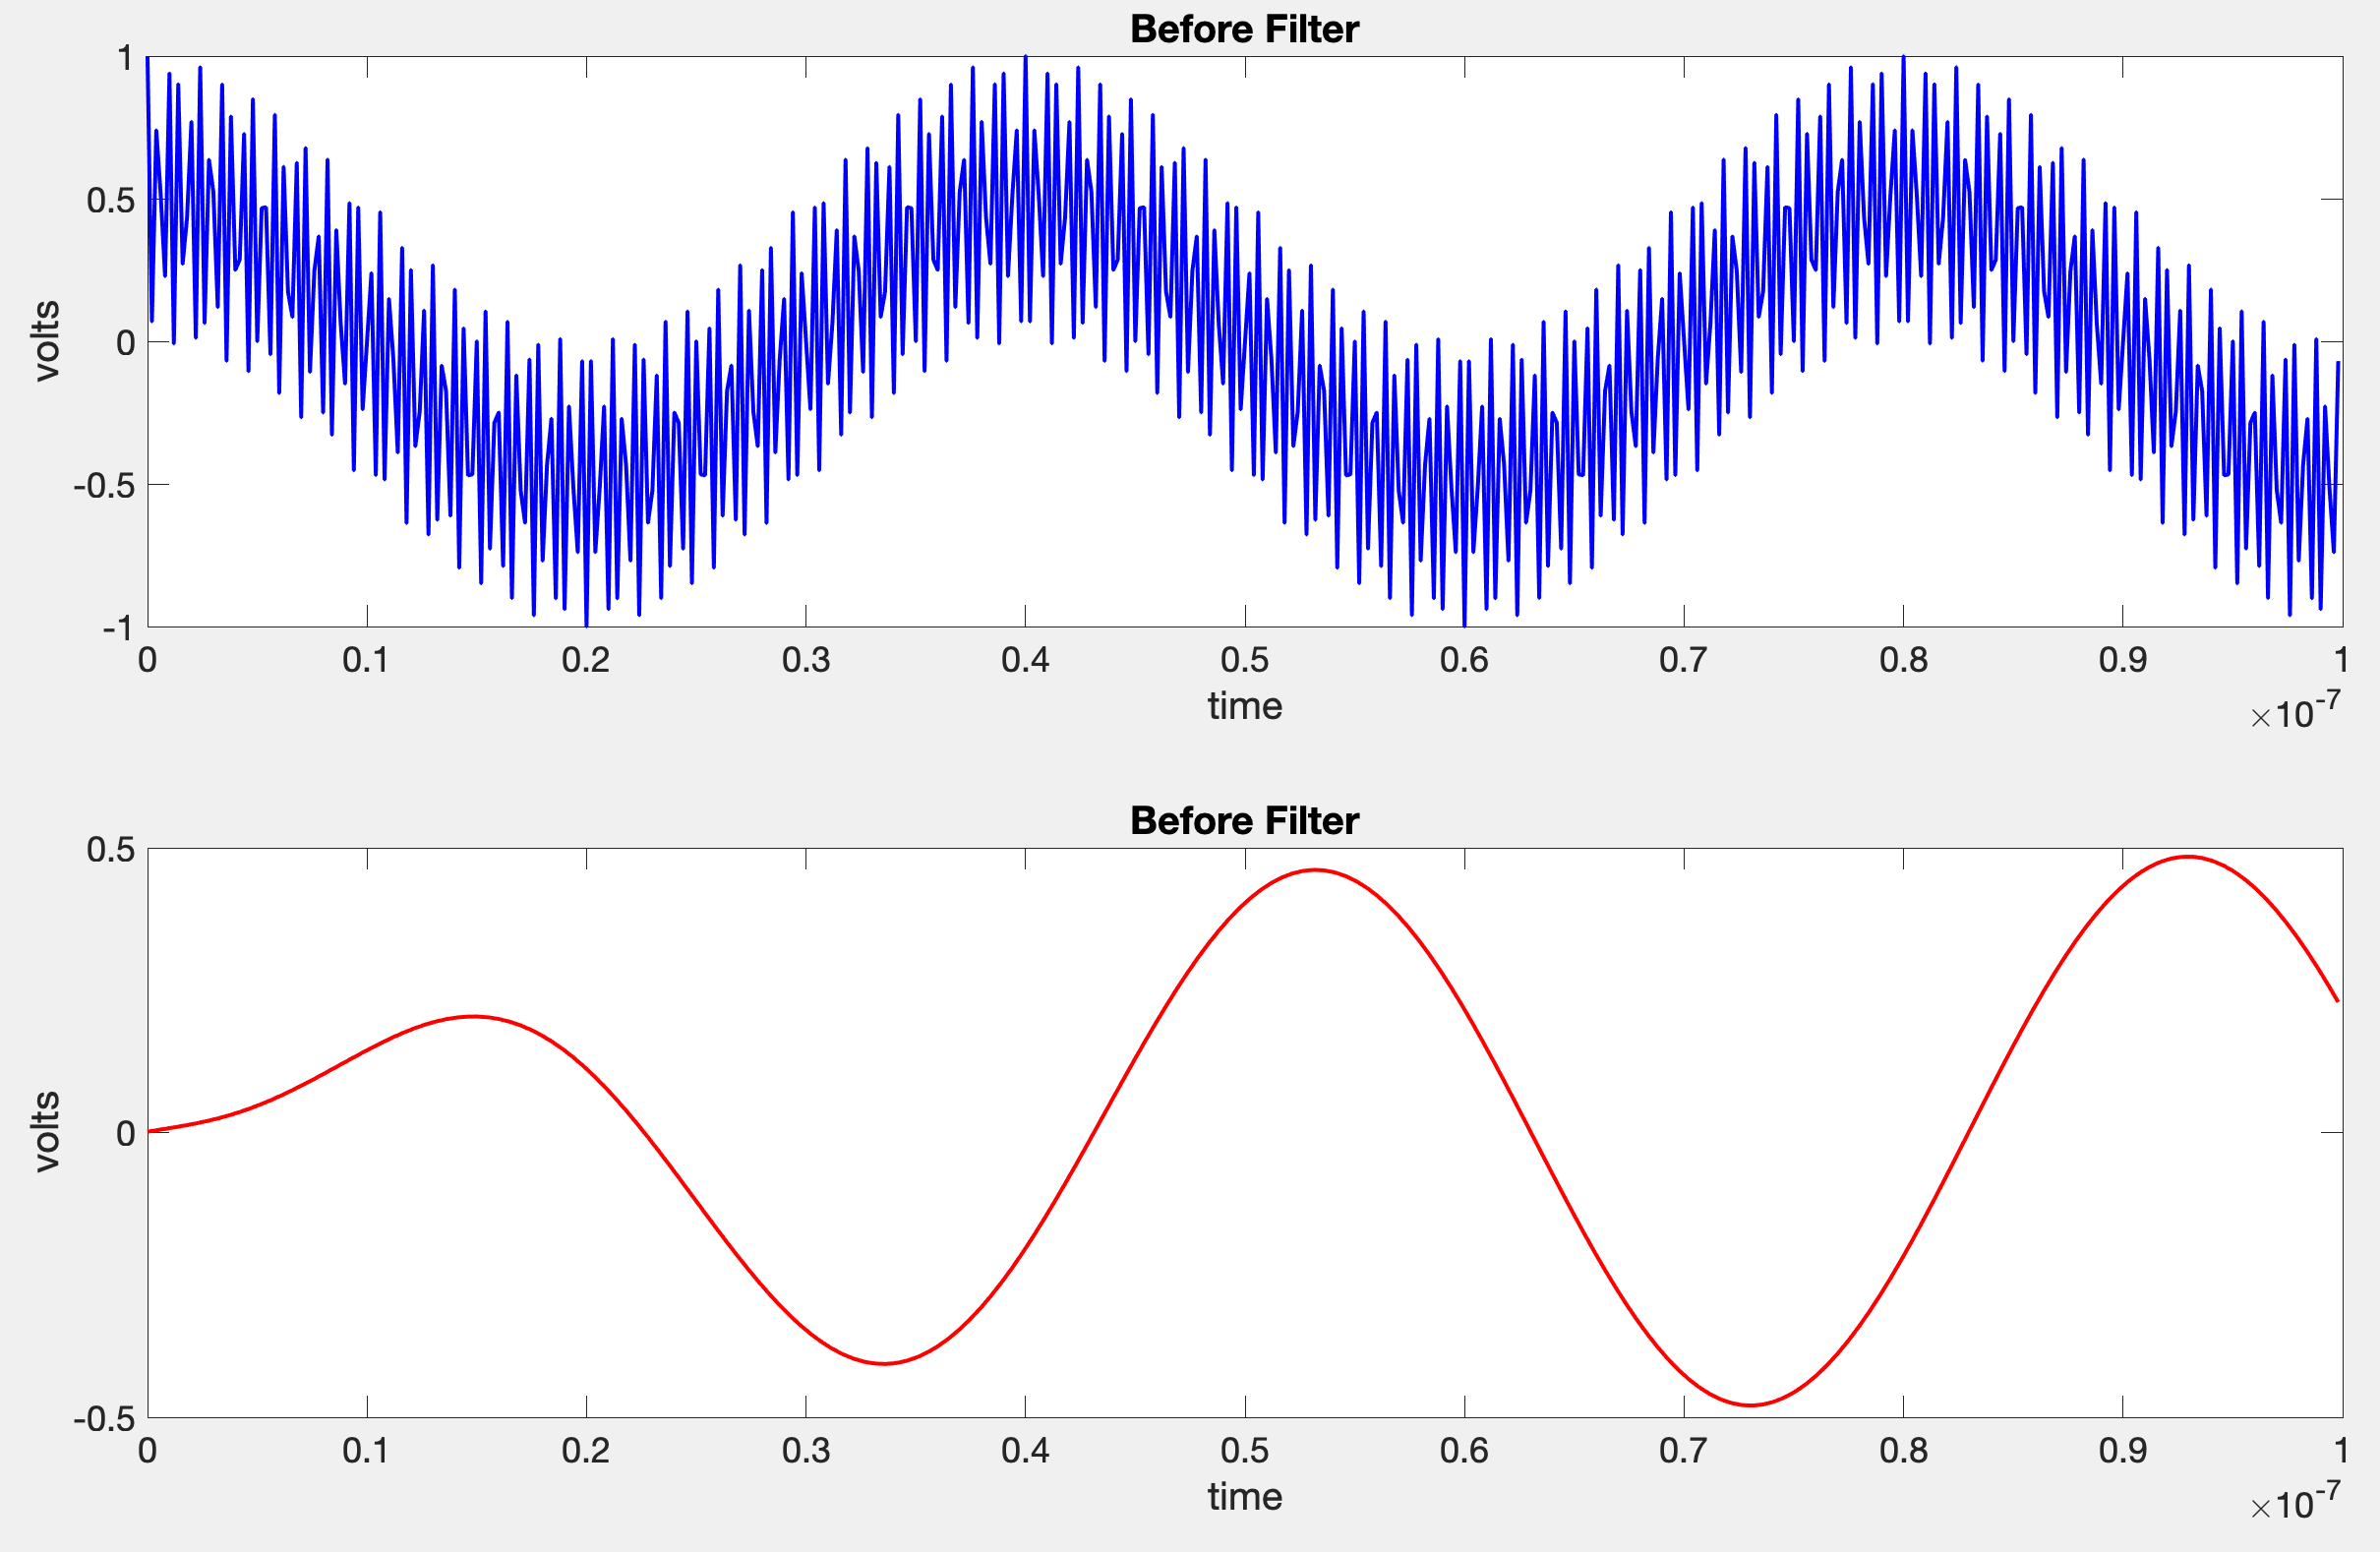
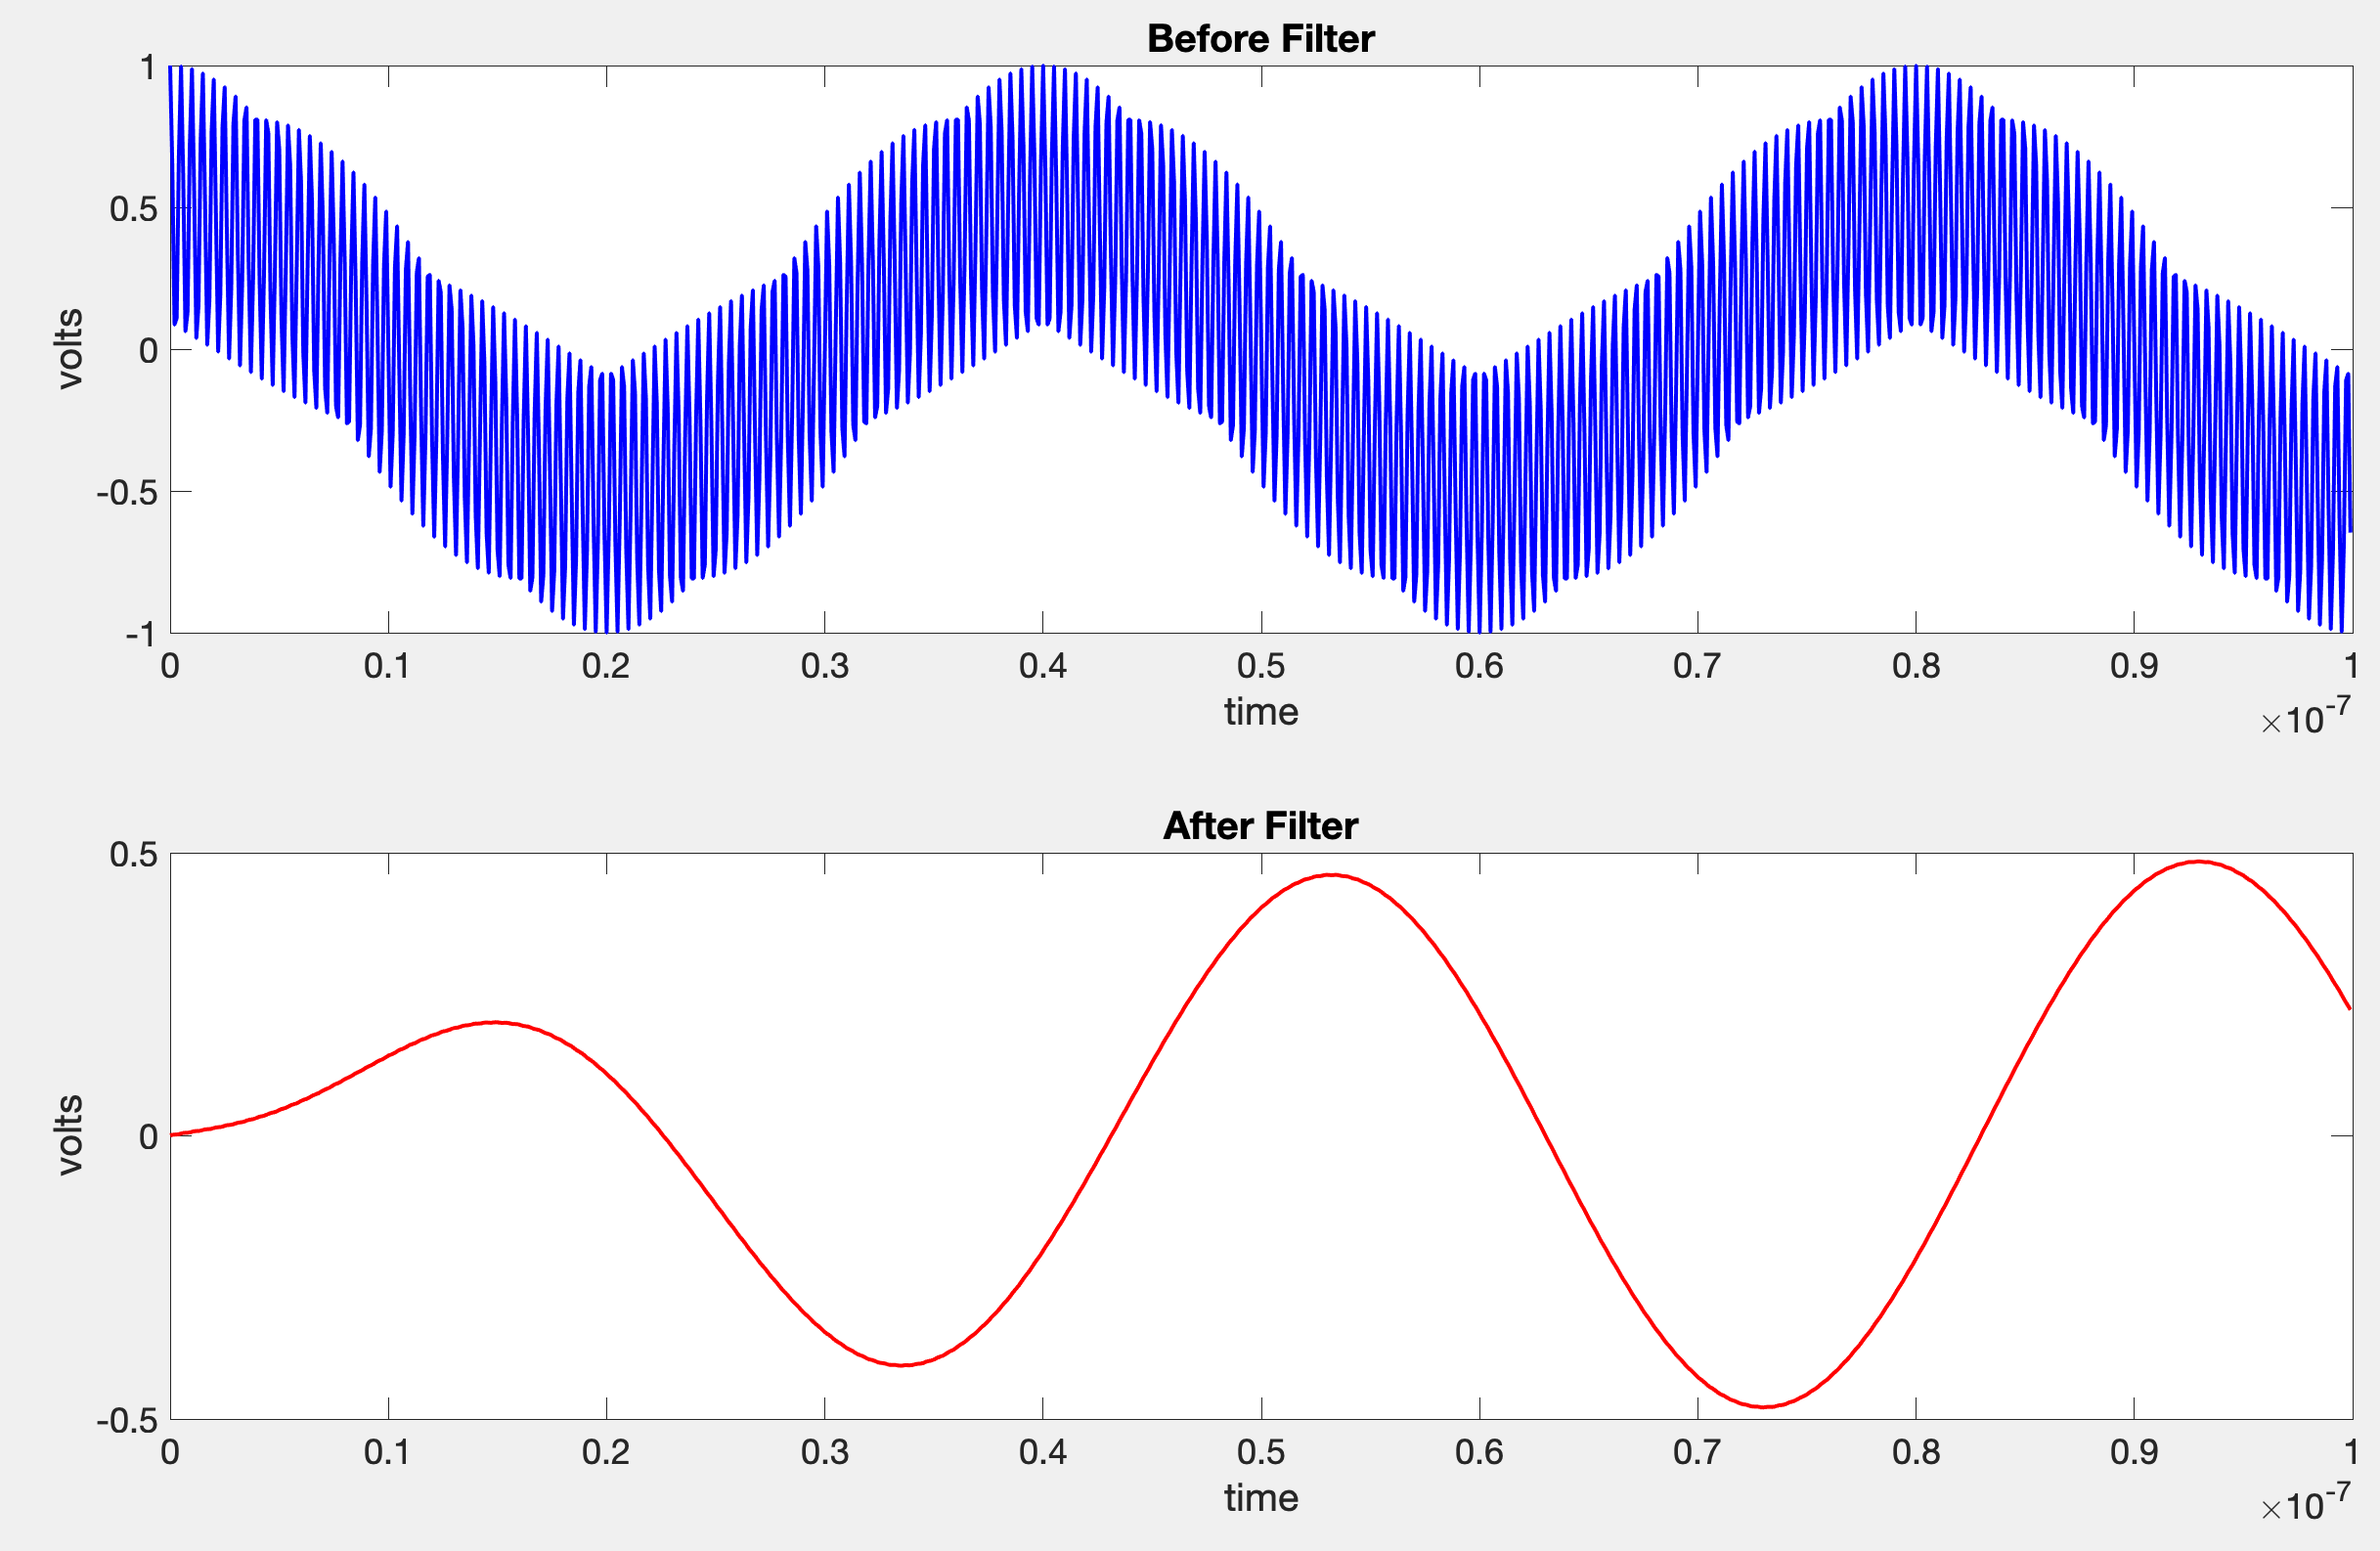
In the script, I apply an IIR filter to remove high-frequency oscillations. The mixed signal before and after the filter is shown below.
Likewise, the FFTs of the transmit signal, complex mixed signal, and filtered complex mixed signal are shown below. Note that the transmit signal, which is real, has a symmetric FFT, while the complex mixed signals are asymmetric in the frequency domain.
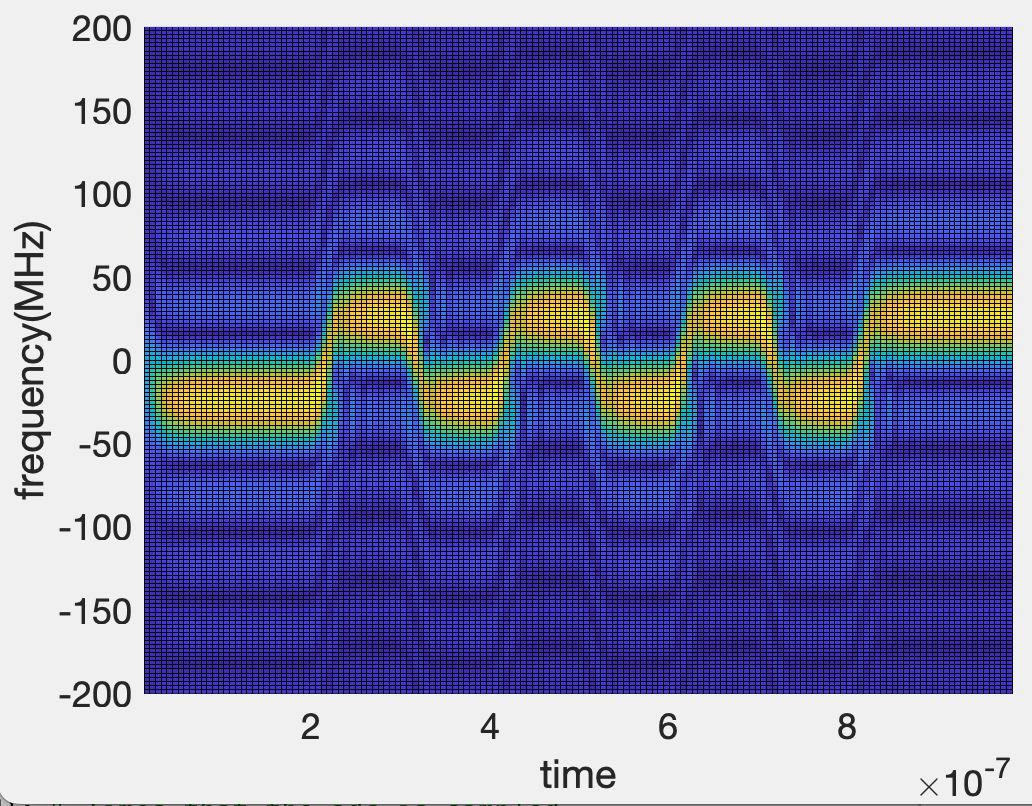
The script also includes a simulation of a matched filter and the ability to transmit multiple bits. For example, a script for transmitting 10 random bits is shown below. The bits transmitted are [0, 0, 1, 0, 1, 0, 1, 0, 1, 1].
Later in the script, I employ a matched filter to detect the signal. The whole script can be found below
clc
clear
close all

f0 = 1.0e9;        %Frequency to send a 0
f1 = 1.05e9;     %Frequency to send a 1
LOf = (f0+f1)/2; % Local oscillator frequency

% Note. Recall that the fft resolution is determined by the length of time
% that is observed. So by using longer pulses we can use a smaller
% bandwidth to transmit the signal. The trade off is (bandwidth vs bitrate)
% (i.e the frequency used for 1 and the frequency used for 0 may be closer
% together)
Tp = 100e-9; % length of the pulse
Fsim = 2.5e9; % Sampling rate for the simulation (not for ADC)
Tsim = 1/Fsim;

tsp = 0:Tsim:Tp; %Time for a single pulse
Tp0 = cos(f0*2*pi*tsp);  % A single pulse for bit 0
Tp1 = cos(f1*2*pi*tsp);  % A single pulse for bit 1
LOI_s = cos(LOf*2*pi*tsp); % The in-phase local oscillator signal for 1 pulse
LOQ_s = cos(LOf*2*pi*tsp+pi/2); % The quadrature " "

figure(1)
subplot(3,1,1)
plot(tsp,Tp0,'linewidth',2);xlabel('time (s)');ylabel('wave voltage')
subplot(3,1,2)
plot(tsp,Tp1,'linewidth',2);xlabel('time (s)');ylabel('wave voltage')
subplot(3,1,3)
plot(tsp,LOI_s,'linewidth',2);xlabel('time (s)');ylabel('wave voltage')

%% Generates random bits and then combines them into a single transmit Signal
bTran = 10; % The number of bits to transfer
txSig = []; % Initialize the transmit signal
startPhase = 0; % The starting phase
bits = [];

% signal
for i=1:bTran
    r=randi(2,1,1)-1;
    if r == 1
        txNext = cos(f1*2*pi*tsp+startPhase);
        startPhase = startPhase+f1*2*pi*tsp(end);
    elseif r == 0
        txNext = cos(f0*2*pi*tsp+startPhase);
        startPhase = startPhase+f0*2*pi*tsp(end);
    end
    txSig = [txSig,txNext(1:(end-1))];
    bits = [bits,r];
end
t = 0:Tsim:(bTran*Tp-Tsim); % Signal transmit time
LOI = cos(LOf*2*pi*t); % Local oscillator signal in-phase
LOQ = cos(LOf*2*pi*t+pi/2); % Local oscillator signal quadrature
%% Simulate Mixing Signals
mixSigI = LOI.*txSig; % Mixes the signal with the LO
mixSigQ = LOQ.*txSig; % Mixes the signal with the LO
mixSig = mixSigI+1i*mixSigQ; % Mixed signal is the combination of LO and
figure(2)
set(gca,'fontsize',18)
subplot(3,1,1);plot(t,txSig,'b','LineWidth',2);xlabel('time');ylabel('volt');title('Transmit')
subplot(3,1,2);plot(t,LOI,'r','Linewidth',2);xlabel('time');ylabel('volt');title('LO')
subplot(3,1,3);plot(t,mixSig,'g','Linewidth',2);xlabel('time');ylabel('volt');title('Mixed')
%% Low Pass Filters the Signal (Part of Mixing
% Design the filter
fp = 2*(f1-LOf); %filter pass frequency
fs = 8*(f1-LOf); %filter stop frequency
rpDB = 0.25; %passband ripple (dB)
rsAt = 40; %Stopband attenuation
[n,wn]=ellipord(fp/Fsim,fs/Fsim,rpDB,rsAt);
[b,a]=ellip(n,rpDB,rsAt,wn,'low');

% Show the filter performance
[H,w]=freqz(b,a,2^13);
maxH = max(abs(H));
figure(3);subplot(2,1,1);plot(w/pi,20*log10(abs(H)/maxH));grid
xlabel('Normalized Frequency');ylabel('Magnitude dB')
subplot(2,1,2);plot(w/pi,angle(H));grid
xlabel('Normalized Frequency');ylabel('Magnitude Squared')

% Apply the filter to the signal
a = a(2:end);
zeroPadMixSig = [zeros(1,length(b)-1),mixSig,zeros(1,length(a))];
mixSigFilt = zeros(1,length(mixSig)+length(a));
for i = (length(a)+1):length(mixSigFilt)
    xinS = i-length(b)+1;
    xinE = i;
    yinS = i-length(a);
    yinE = i-1;
    mixSigFilt(i) = sum(fliplr(b).*zeroPadMixSig(xinS:xinE))-...
                    sum(fliplr(a).*mixSigFilt(yinS:yinE));
end
%% Take FFT of signal
N = 2^10;
mixSigFiltfft = fftshift(fft(mixSigFilt,N));
mixSigfft = fftshift(fft(mixSig,N));
txSigfft = fftshift(fft(txSig,N));
f = ((0:(N-1))/N-1/2)*Fsim;
figure(3)
subplot(3,1,1);plot(f/1e9,abs(txSigfft),'linewidth',2);xlabel('Freq (GHz)');ylabel('Mag');title('FFT transmit signal')
set(gca,'fontsize',18)
subplot(3,1,2);plot(f/1e9,abs(mixSigfft),'linewidth',2);xlabel('Freq (GHz)');ylabel('Mag');title('FFT mixed IQ signal')
set(gca,'fontsize',18)
subplot(3,1,3);plot(f/1e9,abs(mixSigFiltfft),'linewidth',2);xlabel('Freq (GHz)');ylabel('Mag');title('Filtered mixed IQ signal')
set(gca,'fontsize',18)

% Show unfiltered and filtered signal in time and frequency
figure(4)
subplot(2,1,1);plot(t,real(mixSig),'b','linewidth',2);xlabel('time');ylabel('volts');title('Before Filter');set(gca,'fontsize',18)
subplot(2,1,2);plot(t,real(mixSigFilt((length(a)+1):end)),'r','linewidth',2)
xlabel('time');ylabel('volts');title('Before Filter');set(gca,'fontsize',18)

%% Take a Short Time Fourier Transform of the Filtered Signal
winL = ceil(length(Tp0)/4);
[s_stft,f_stft,t_stft] = stft(mixSigFilt,Fsim,'FFTLength',N,'Window',ones(winL,1));
figure(5),pcolor(repmat(t_stft.',size(s_stft,1),1),repmat(f_stft/1e6,1,size(s_stft,2)),abs(s_stft));xlabel('time');ylabel('frequency')
set(gca,'fontsize',18);xlabel('time');ylabel('frequency(MHz)')
ylim([-200 200])

%% Sample Using the ADC
Fbmax = f1-LOf; % The maximum beat frequency (difference in local oscillator and transmit frequency)
Fadc = 3*Fbmax; % I only need to do 2*Fbmax (according to nyquist) but do to
Tadc = 1/Fadc; % The sampling period of the adc
tadc = 0:Tadc:t(end); % Times that the adc is sampled
mixSigFiltADC = interp1(t,mixSigFilt((length(a)+1):end),tadc); % Interpolates to get sampled value by adc

% Displays the ADC data
figure(6)
plot(tadc,real(mixSigFiltADC),tadc,imag(mixSigFiltADC),'linewidth',2)

% Takes the STFT of the ADC data and plots it
figure(7)


%% Creates a matched filter to determine frequency
mix0 = LOI_s.*Tp0+1i*LOQ_s.*Tp0; % The mixed signal for bit 0
mix1 = LOI_s.*Tp1+1i*LOQ_s.*Tp1; % The mixed signal for bit 1

%
zeroPadMix0 = [zeros(1,length(b)-1),mix0,zeros(1,length(a))]; % Zero pads the mix filters prior to filtering
zeroPadMix1 = [zeros(1,length(b)-1),mix1,zeros(1,length(a))];

filt0 = zeros(1,length(mix0)+length(a)); % Holds the matched filters
filt1 = zeros(1,length(mix1)+length(a)); %

% Applies filter to expected signal
for i = (length(a)+1):length(filt0)
    xinS = i-length(b)+1;
    xinE = i;
    yinS = i-length(a);
    yinE = i-1;
    filt0(i) = sum(fliplr(b).*zeroPadMix0(xinS:xinE))-...
                    sum(fliplr(a).*filt0(yinS:yinE));
    filt1(i) = sum(fliplr(b).*zeroPadMix1(xinS:xinE))-...
                    sum(fliplr(a).*filt1(yinS:yinE));
end

matchFilt0 = fliplr(filt0);
matchFilt1 = fliplr(filt1);

% Sample the matchFilter using the ADC
tadcMF = 0:Tadc:Tp;
matchFilt0_ADC = interp1(tsp,matchFilt0((length(a)+1):end),tadcMF);
matchFilt1_ADC = interp1(tsp,matchFilt1((length(a)+1):end),tadcMF);

%% Apply Matched Filter to Determine Frequency
% Zero pads the received signal
is0 = conv(mixSigFiltADC,matchFilt0_ADC,'valid');
is1 = conv(mixSigFiltADC,matchFilt1_ADC,'valid');

figure(8)
subplot(2,1,1);plot(abs(is0),'r','linewidth',2)
subplot(2,1,2);plot(abs(is1),'b','linewidth',2)
grid on

