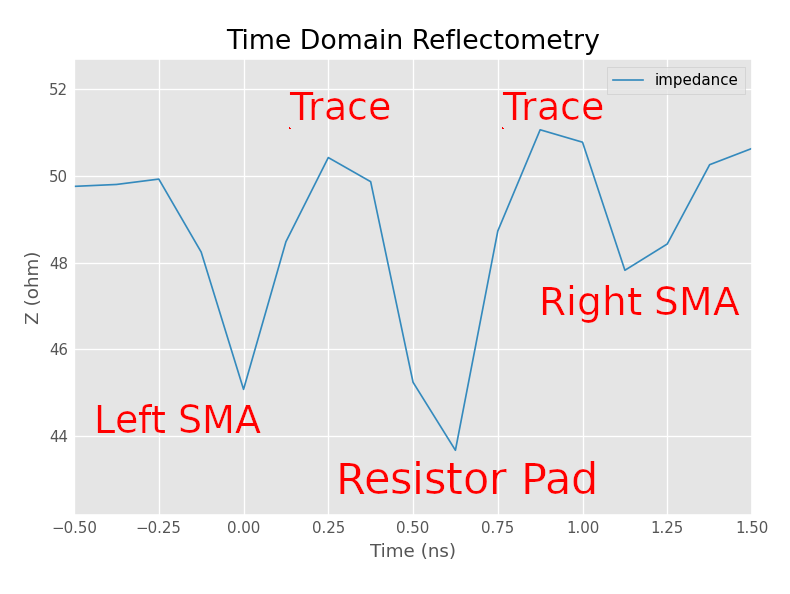
By taking an Inverse Fourier Transform, it's possible to convert S11 measurements from a VNA to its equivalent time-domain response as measured by a TDR. Previously, this capability is often exclusive in expensive simulation packages or in the firmware of expensive VNAs. Now, with the power of scikit-rf, a free and open source Python software library for RF/microwave modeling and analysis, it's now accessible to everyone with basic programming knowledge.
Here's a demo from my recent experiment (this is only meant to be a quick example, the measurement is not fully calibrated and the parameters used for the calculations are not optimized, so please don't complain too much about the data).
To evaluate the impedance discontinuity and signal integrity impact caused by a 1206 resistor footprint, I fabricated a test fixture shown in the picture below.
It's a 4-layer circuit board with three solid ground planes. Two through-hole SMA connectors are located on both ends, with a 50-ohm microstrip in between. At the center is the Device Under, a 0-ohm, 1206 resistor. Also, to compensate for the excess capacitance caused by the large resistor pads, part of the ground plane under the resistor body is partially removed.
After I've received the board, I measured its S11 from 10 MHz to 4 GHz using a Vector Network Analyzer. It shows the return loss is good up to 1.2 GHz. But is it the full picture?
Using the scikit-rf software library and the following Python code, we can transform the data from frequency domain to time domain.
import sys
import skrf
import matplotlib.pyplot as plt
skrf.stylely()

network = skrf.Network(sys.argv[1])
network_dc = network.extrapolate_to_dc(kind='linear')

plt.figure()
plt.title("Time Domain Reflectometry")
network_dc.s11.plot_z_time_step(window='hamming', label="impedance")
plt.xlim((-0.5, 1.5))

plt.tight_layout()
plt.show()
This calculated TDR plot immediately reveals that the test fixture was poorly designed with non-ideal SMA-to-microstrip transitions. When the signal hits the first SMA connector, the instantaneous impedance drops to 45 ohms due to a capacitive discontinuity, then it hits the 50-ohm trace, hits the device-under-test, hits the 50-ohm trace again, and finally hits the second connector.
In fact, after de-embedding, it turned out that the resistor footprint only has 20 dB return loss at 800 MHz, not 1.2 GHz. The bad SMA connector footprints and the resistor footprint actually compensated each other. It would be difficult to spot this problem using the Smith Chart, on the other hand, it's obvious from the computed TDR response.
You can find more information from scikit-rf's documentation, Time domain reflectometry, measurement vs simulation. scikit-rf also supports time-gating, it's possible to use time-gating as a simple way to de-embed the connectors from the DUT by deleting the reflections from the time domain, see Time Domain and Gating.


