deleted 11 characters in body
Source Link
user94729
user94729

[POST IS EDITED]

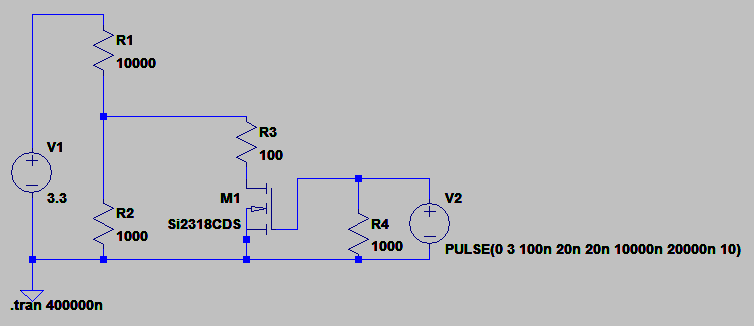
I'm trying to debug a circuit shown in Fig. 1.

enter image description here

The gate of the FET is driven with a square wave 0...3 volts. The voltage source V1 = 3.3V. The circuit is built to control the voltage presented to the non-inverting input of an operational amplifier. R2 and R3 are trimmers, so the two input voltages can be trimmed to different values if needed.

Driving the FET with a square wave I notice a rather odd behaviour. The voltage between R1 and R2 are shown in Fig. 2 as a function of time (green). The voltage of Vgs is drawn blue. enter image description here

As can be seen, the voltage v+ first dips to a negative value and then rises slowly to the steady state value. When the voltage v+ should drop to the lower value (vgs = 3 V) it first overshoots after going down to the steady state. The simulation and oscilloscope measurements agree together.

What could be causing this, and how can i get the voltage between R1 and R2 (green waveform) to be as closes as a square wave as possible. Fet in use is Si2318CDS. Datasheet provided in the comment. I have tried higher Vgs amplitudes han 3V.

Br, Mikko
[POST IS EDITED]

I'm trying to debug a circuit shown in Fig. 1.

enter image description here

The gate of the FET is driven with a square wave 0...3 volts. The voltage source V1 = 3.3V. The circuit is built to control the voltage presented to the non-inverting input of an operational amplifier. R2 and R3 are trimmers, so the two input voltages can be trimmed to different values if needed.

Driving the FET with a square wave I notice a rather odd behaviour. The voltage between R1 and R2 are shown in Fig. 2 as a function of time (green). The voltage of Vgs is drawn blue. enter image description here

As can be seen, the voltage v+ first dips to a negative value and then rises slowly to the steady state value. When the voltage v+ should drop to the lower value (vgs = 3 V) it first overshoots after going down to the steady state. The simulation and oscilloscope measurements agree together.

What could be causing this, and how can i get the voltage between R1 and R2 (green waveform) to be as closes as a square wave as possible. Fet in use is Si2318CDS. Datasheet provided in the comment. I have tried higher Vgs amplitudes han 3V.

added 293 characters in body
Source Link
user94729
user94729

[POST IS EDITED]

I'm trying to debug a circuit shown in Fig. 1.

[![enter image description here][1]][1]enter image description here

The gate of the FET is driven with a square wave 0...3 volts. The voltage source V1 = 3.3V. The circuit is built to control the voltage presented to the non-inverting input of an operational amplifier. R2 and R3 are trimmers, so the two input voltages can be trimmed to different values if needed.

Driving the FET with a square wave I notice a rather odd behaviour. The voltage at the inverting input isbetween R1 and R2 are shown in Fig. 2 as a function of time (green).

[![enter image description here][2]][2] The voltage of Vgs is drawn blue. enter image description here

As can be seen, the voltage v+ first dips to a negative value and then rises slowly to the steady state value. When the voltage v+ should drop to the lower value (vgs = 3 V) it first overshoots after going down to the steady state. The simulation and oscilloscope measurements agree together.

What could be causing this, and how can i get the voltage between R1 and R2 (green waveform) to be as closes as a square wave as possible. Fet in use is Si2318CDS. Datasheet provided in the comment. I have tried higher Vgs amplitudes han 3V.

Br, Mikko [1]: https://i.sstatic.net/HGPbS.png [2]: https://i.sstatic.net/NaWgH.png

I'm trying to debug a circuit shown in Fig. 1.

[![enter image description here][1]][1]

The gate of the FET is driven with a square wave 0...3 volts. The voltage source V1 = 3.3V. The circuit is built to control the voltage presented to the non-inverting input of an operational amplifier. R2 and R3 are trimmers, so the two input voltages can be trimmed to different values if needed.

Driving the FET with a square wave I notice a rather odd behaviour. The voltage at the inverting input is shown in Fig. 2 as a function of time.

[![enter image description here][2]][2]

As can be seen, the voltage v+ first dips to a negative value and then rises slowly to the steady state value. When the voltage v+ should drop to the lower value (vgs = 3 V) it first overshoots after going down to the steady state.

What could be causing this. I have tried higher Vgs amplitudes han 3V.

Br, Mikko [1]: https://i.sstatic.net/HGPbS.png [2]: https://i.sstatic.net/NaWgH.png

[POST IS EDITED]

I'm trying to debug a circuit shown in Fig. 1.

enter image description here

The gate of the FET is driven with a square wave 0...3 volts. The voltage source V1 = 3.3V. The circuit is built to control the voltage presented to the non-inverting input of an operational amplifier. R2 and R3 are trimmers, so the two input voltages can be trimmed to different values if needed.

Driving the FET with a square wave I notice a rather odd behaviour. The voltage between R1 and R2 are shown in Fig. 2 as a function of time (green). The voltage of Vgs is drawn blue. enter image description here

As can be seen, the voltage v+ first dips to a negative value and then rises slowly to the steady state value. When the voltage v+ should drop to the lower value (vgs = 3 V) it first overshoots after going down to the steady state. The simulation and oscilloscope measurements agree together.

What could be causing this, and how can i get the voltage between R1 and R2 (green waveform) to be as closes as a square wave as possible. Fet in use is Si2318CDS. Datasheet provided in the comment. I have tried higher Vgs amplitudes han 3V.

Br, Mikko

edited tags
Link
user94729
user94729
Source Link
user94729
user94729
Loading