Kindly any one show me the graph for inductor current and if possible explain it. I shall be very grateful!
It's quite easy to do if you use a simulator (like Micro-cap): -
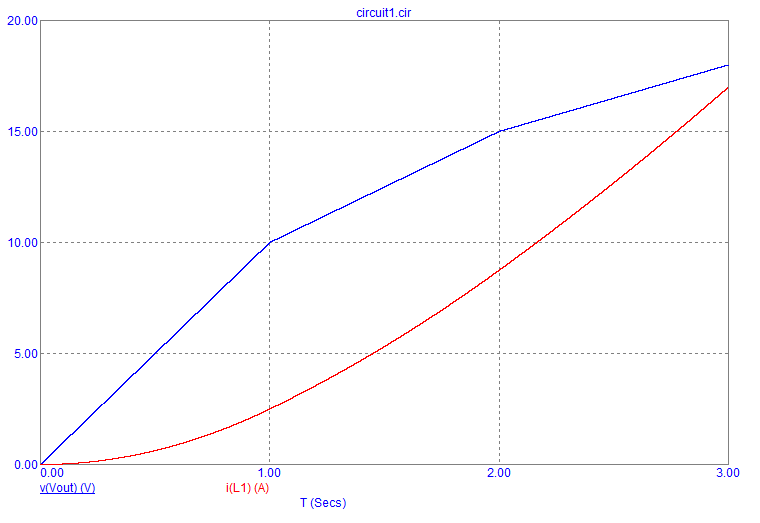
Voltage in blue and current through a 2 henry inductor in red. Timebase in seconds.
The current-voltage relationship for an inductor is: -
$$V = L\dfrac{di}{dt}$$
The above can be solved for current by integrating both sides.
$$i = \dfrac{1}{L}\int{v\: dt}$$
And, for a linearly rising voltage (\$v = V_{PK}\cdot t\$),
$$i = \dfrac{V_{PK}}{L}\int{t\: dt} = \dfrac{V_{PK}}{2L}t^2$$
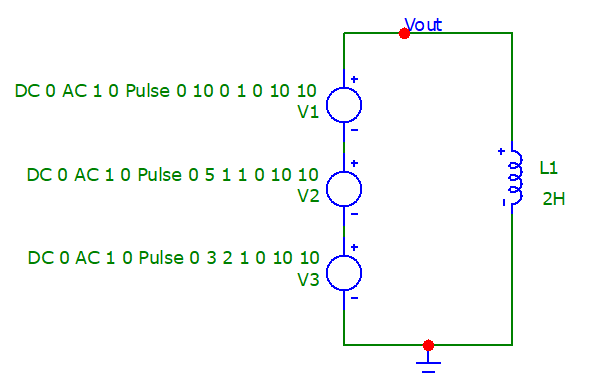
Circuit: -
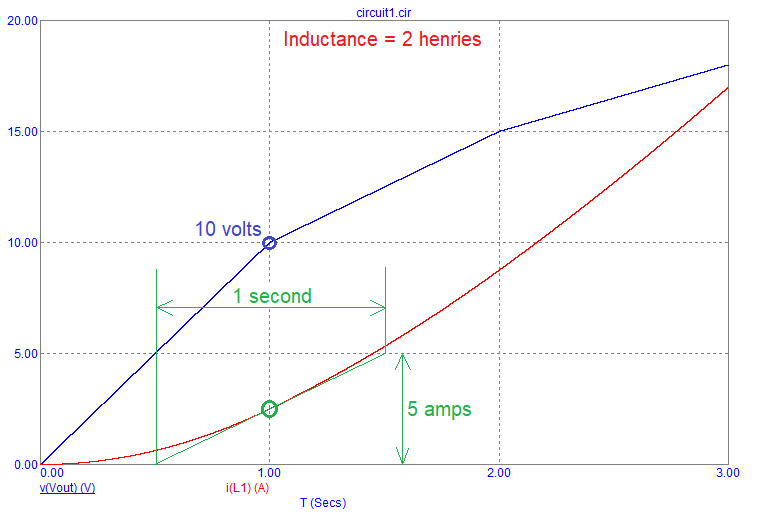
Slope of the current graph
This is just to show that visualizing the slope helps to understand the formula. I've got a green circle on the current graph and I've visually calculated the slope to be 5 amps per second. This corresponds with an applied voltage at that moment (blue circle) of 10 volts and, given that the inductance is 2 henry, the slope mathematically agrees because: -
$$\dfrac{V}{L} = \dfrac{di}{dt} = 5\text{ amps per second}$$


