5
\$\begingroup\$

Background

I have a device with a NiMH battery. This is a portable device, so I need to know how much battery I have left at all times.

To achieve this, I want to map the battery voltage to a percentage between 0% and 100%.

Characteristics

The battery I am dealing with gives me the following information (printed in the device):

NiMH Battery 7.2V, 400mAh

Manual Information:

Battery voltage V: 6 ~ 10

Nominal capacity (mAh): >=400

Power(Wh): 2.4-4

Charging temperature (Celcius): 0 - 45

Research

I have read some articles indicating that this is possible, but unfortunately I have not found the mathematical formula they used ( page 6 of 14 ):

http://data.energizer.com/pdfs/nickelmetalhydride_appman.pdf

Problem

What is the algorithm that, given the current voltage of the battery, can tell me how much % I have left?

\$\endgroup\$
10
  • \$\begingroup\$ Upvoting even if the answer to your literal question will likely be a simple "No". But the "No" can be explained in more detail, which would be educational. \$\endgroup\$
    – pipe
    Commented May 22, 2018 at 9:10
  • \$\begingroup\$ I have updated the question with a link to an article I found. I believe this is possible, I just don't know the formula. \$\endgroup\$ Commented May 22, 2018 at 9:41
  • 2
    \$\begingroup\$ On the contrary, your document literally has this sentence on page 9: The flatness of the voltage plateau under normal discharge rates, and due to dependence on cycles and time parameters, voltage sensing cannot be used to accurately determine state-of-charge. \$\endgroup\$
    – pipe
    Commented May 22, 2018 at 9:48
  • \$\begingroup\$ This is confusing to me. How comes they made a graphic then? And how do many people manage to do a similar graph but with hours instead of %? Does it mean that any app that shows a battery life for NiMH batteries is lying to me? \$\endgroup\$ Commented May 22, 2018 at 9:50
  • \$\begingroup\$ Maybe the graphic doesn't mean what you think it means, which figure are you looking at? I think it relies on knowing the battery charging and discharge history, possibly also temperature. \$\endgroup\$
    – pipe
    Commented May 22, 2018 at 9:55

1 Answer 1

3
\$\begingroup\$

Answer

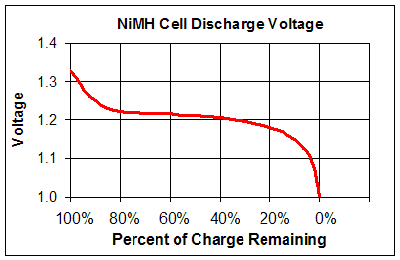
By analyzing the discharge rate curve of the battery we have:

discharge rate

PS: We don't actually have a discharge graph for our specific batteries, so this is the closest thing I could find. Serves to give you an idea.

We were able to identify 3 stages:

  1. from 100% to 80%
  2. from 80% to 20%
  3. 20% downwards

With this in mind, we created 3 mathematical formulae, one for each stage. Do note that this formulae are mathematical approximations and are not as precise as the ones the papers would give us, but given the time we have we went with them for now.

v > 8400 x = 100

v > 7320 x = 90+(10*(v-7320)/(8400-7320))

v > 6900 x = 15+(75*(v-6900)/(7320-6900))

v > 6000 x = 15*(v-6000)/(6900-6000)

v < 6000 x = 0

Where v is voltage.

We still need to adjust them a little, but for now this is what we have.

\$\endgroup\$
1
  • 1
    \$\begingroup\$ I used some Rayovac AAA Ni-MH cells that were mostly new in a small flashlight. The incandescent flashlight went from normal brightness to a dim red glow in less than 10 seconds when one of the two AAA cells died. That's how fast the end of charge drop off can be. As the cells aged this sudden drop off didn't happen as much. So that graph may only be accurate for a certain brand at a certain point during its cycle life, and only if the cell hasn't been abused. \$\endgroup\$ Commented Mar 26, 2019 at 15:19

Your Answer

By clicking “Post Your Answer”, you agree to our terms of service and acknowledge you have read our privacy policy.

Not the answer you're looking for? Browse other questions tagged or ask your own question.