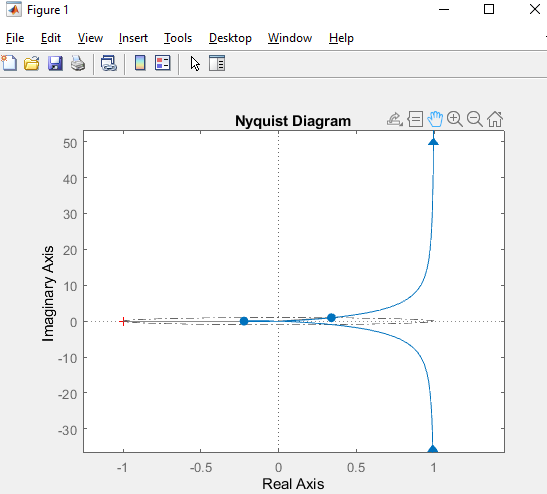
It is the unit circle. It is centered at origin and has radius 1. It represents all points on the GH-plane which have a gain of 1.
The phase margin of the system depends on the angle of the transfer function when the gain is 1. So, all the points on your Nyquist contour which touch / cross this circle are points at which you can evaluate a phase margin.
The circle is just a helpful visual indicator to help us judge the scale of the plot and get a quick idea of the points where the contour has unity gain.
Since you seem to be using Matlab, right click on the plot and select the option to show all the margins of the system and note that the phase margins are marked at the point where the contour crosses this circle which represents gain of 1.
Similar to phase margin, the gain margin depends on the points on the negative real axis. That line is already present in the plot as a part of the x axis, so it is not as quickly noticed as the circle.

